3 posts tagged with "scalability"

View All Tags

· 5 min read
Blake Romano
Carlos Santana
Greg Haynes
Manabu McCloskey

Creating and managing an internal developer platform (IDP) is a complex and time-consuming challenge. As outlined on our website and in the CNCF Platforms white paper, IDPs consist of capabilities. This centralized system facilitates developers in designing, building, deploying, and managing applications and services within an organization. It offers a suite of tools, APIs, and services that streamline the development process by providing essential capabilities.

idpBuilder is meant for application developers and platform engineers looking to quickly spin up a repeatable IDP environment. With just a single binary and Docker as the only dependency, idpBuilder allows you to create a fully functional IDP leveraging popular open source projects such as Kubernetes, ArgoCD, and Backstage.

For most use cases, you need to run one command to get started. For example, to get started with the CNOE reference implementation all you have to run is:

idpbuilder create --use-path-routing \
--package https://github.com/cnoe-io/stacks//ref-implementation

img

In addition to its simplicity, idpBuilder offers the following key benefits:

  1. Rapid Deployment: Create a reference implementation of an IDP with minimal setup time.
  2. CI Integration: Easily incorporate idpBuilder into your continuous integration workflows for comprehensive testing.
  3. Local Development: Provide IDP engineers with a consistent and easily reproducible local development environment.

Let's explore how you can use idpBuilder in your development workflow. Whether you're looking to demonstrate an IDP reference implementation, enhance your CI pipeline, or improve your local development setup, idpBuilder offers a solution that's both powerful and easy to use.

Demo your own IDP implementation

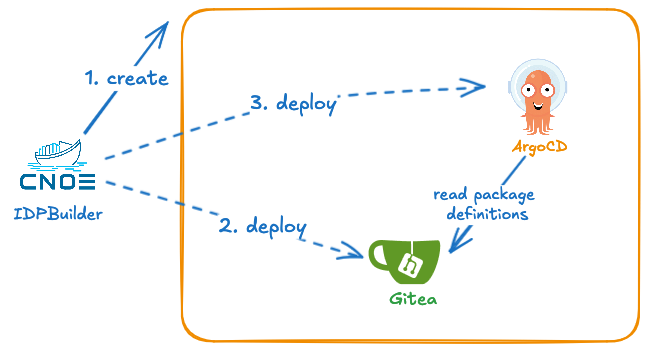
idpBuilder comes with a set of technologies that enables GitOps workflows all contained within the ephemeral environment. Think of building your IDP solution in a box. It does this by provisioning a kind cluster, Gitea server, ArgoCD, and ingress-nginx. See our documentation site for more information.

in addition, idpbuilder can copy files and Kubernetes manifests checked into Git repositories to the in-cluster Gitrea repositories. Once copied to the in-cluster repositories, ArgoCD can use them to deploy your solutions in minutes. We have examples of this in the Stacks repository.. You can run them in your browser using Codespaces as well. This approach also allows you to experiment with configuration changes and code changes without changing files checked into the external repositories because everything is contained in the cluster.

Carlos Santana does an excellent job of show this in his video. https://www.youtube.com/watch?v=e6Fvivx4Aw8

Local Development and CI integrations

Due to the number of technologies involved and the complexity in integrating them, many organizations struggle with fragmented development environments. Different teams often work in silos, using disparate tools and workflows. This fragmentation is a major barrier for organizations hoping to create cohesive internal developer platforms as it is difficult to design and develop features which span multiple capabilities. Furthermore, the lack of a reference development environment leads to significant inefficiencies including slower development cycles, especially for cross-capability functionality. idpBuilder can set up identical environments for local development and CI pipelines. With idpBuilder, you get:

  1. Reduced "It Works on My Machine" Syndrome: With consistent environments, discrepancies between local and CI setups become a thing of the past.
  2. Early Issue Detection: Integration problems are caught earlier, saving time and resources in the long run.
  3. Improved Collaboration: Developers can confidently work on the same project, knowing they're all using identical environments.
  4. Streamlined Workflow: The seamless transition from local development to CI pipelines accelerates the development cycle.
  5. Local GitOps Workflow: A zero-configuration approach to GitOps: start immediately with a pre-configured local Git server, no external repositories or credentials required.

During KubeCon 2024, AutoDesk touches on these topics and shares their experience using it for their platform development: https://www.youtube.com/watch?v=x_cTXvRgwdA

Crossplane Testing

Another example use of idpBuilder is in development and testing with Crossplane functions. At the All Day DevOps event, Imagine Learning highlighted their use of idpBuilder:

  • Local Development: idpBuilder deploys Crossplane, a local OCI registry, composite resource definitions, compositions, and composition functions within a single local Kubernetes environment.
  • Enhanced Security: This setup avoids publishing images to public registries, improving security and privacy posture.
  • Local AWS Simulation: A local stack simulates an AWS environment, enabling thorough testing without external resources.

More details about their implementation can be found in their repository and their presentation at the All Day DevOps event.

Conclusion

idpBuilder simplifies creating and testing Internal Developer Platform Capabilities, solving common development and maintenance challenges. It allows you to rapidly deploy functional solutions with minimal setup by offering consistency across development stages.

However, idpBuilder isn't a one-size-fits-all solution. Organizations must assess their specific needs and existing infrastructure. While it's excellent for testing and development, production deployments may need further adjustments.

Overall, idpBuilder enhances IDP management, making it worth exploring for teams aiming to improve development processes and environmental consistency.

Take the Next Step:

  1. Try idpBuilder: Download and start using idpBuilder today.. Follow our quick-start guide in the documentation to set up your first IDP environment.
  2. Join Our Community: Have questions or want to share your experience? Join our community on Slack. We're here to help and learn from each other.
  3. Learn More: Explore our documentation and resources on our website to deepen your understanding of idpBuilder and its capabilities.
  4. Contribute: idpBuilder is an open-source project, and we welcome contributions. Whether it's code, documentation, or feature suggestions, your input can help shape the future of idpBuilder.

· 18 min read
Andrew Lee
Vikram Sethi

Introduction

In our earlier blog posts, we have discussed scalability tests for Argo CD, where in two consecutive experiments, we pushed the limits of Argo CD to deploy 10,000 applications on ~100 clusters and then 50,000 applications on 500 clusters along with configuration and fine-tuning required to make Argo CD scale effectively. Argo CD deployments, however, do not happen in isolation, and similar to a CNOE stack, Argo CD is often deployed on a cluster along with other tooling which collectively contribute to the performance and scalability bottlenecks we see users run into.

Argo Workflows is one common tool we often see users deploy alongside Argo CD to enable workflow executions (e.g. building images, running tests, cutting releases, etc). Our early experiments with Argo Workflows revealed that, if not tuned properly, it can negatively impact the scalability of a given Kubernetes cluster, particularly if the Kubernetes cluster happens to be the control cluster managing developer workflows across a large group of users. A real world example of some of the scaling challenges you can encounter with Argo Workflows is explored in our recent ArgoCon talk: Key Takeaways from Scaling Adobe's CI/CD Solution to Support 50K Argo CD Apps.

For us to better understand the limitations and tuning requirements for Argo Workflows, in this blog post we publish details on the scalability experiments we ran for Argo Workflows executing Workflows in two different load patterns: increasing rate up to 2100 workflows/min and queued reconciliation of 5000 workflows on an Amazon EKS cluster with 50x m5.large nodes. We show the correlation between the various Argo Workflow's knobs and controls and the processing time as well as performance improvements you can get by determining how you supply the workflows to the control plane.

Test Parameters

Test Workflow

The test workflow is based on the lightweight whalesay container from docker which prints out some text and ASCII art to the terminal. The reason we chose a lightweight container is that we wanted to stress the Argo Workflows controller in managing the Workflow lifecycle (pod creation, scheduling, and cleanup) and minimize the extra overhead on the Kubernetes control plane in dealing with the data plane workloads. An example of the Workflow is below:

var helloWorldWorkflow = wfv1.Workflow{
ObjectMeta: metav1.ObjectMeta{
GenerateName: "hello-world-",
},
Spec: wfv1.WorkflowSpec{
Entrypoint: "whalesay",
ServiceAccountName: "argo",
Templates: []wfv1.Template{
{
Name: "whalesay",
Container: &corev1.Container{
Image: "docker/whalesay:latest",
Command: []string{"cowsay", "hello world"},
},
},
},
PodGC: &wfv1.PodGC{
Strategy: "OnPodSuccess",
},
},
}

Argo Workflows Settings

We will be detailing how each of these settings affect Argo Workflow in various experiments later in this blog post.

  • Controller workers: Argo Workflows controller utilizes different workers for various operations in a Workflow lifecycle. We will be looking at t types of workers for our scalability testing.

    • workflow-workers (default: 32): These workers are threads in a single Argo Workflows controller that reconcile Argo Workflow Custom Resources (CRs). When a Workflow is created, a workflow-worker will handle the end-to-end operations of the Workflow from ensuring the pod is scheduled to ensuring the pod has finished. The number of workers can be specified by passing the --workflow-workers flag to the controller.

    • pod-cleanup-workers (default: 4): These workers clean up finished Workflows. When a Workflow has finished executing, depending on your clean-up settings, a pod-cleanup-worker will handle cleaning up the pod from the Workflow. The number of workers can be specified by passing the --pod-cleanup-workers flag to the controller.

  • Client queries per second (QPS)/Burst QPS settings (default: 20/30): These settings control when the Argo Workflows controller’s Kubernetes (K8s) client starts to throttle requests to the K8S API server. The client QPS setting is for limiting sustained QPS for the k8s client while burst QPS is for allowing a burst request rate in excess of the client QPS for a short period of time. The client QPS/burst QPS can be set by passing the --qps and --burst flag to the controller.

  • Sharding: Sharding with multiple Argo Workflows controllers is possible by running each controller in its own namespace. The controller would only reconcile Workflows submitted in that particular namespace. The namespace of each controller can be specified with the --namespaced flag.

Key Metrics

We chose a set of key metrics for the scalability testing because we wanted to measure how many workflows the Argo Workflows controller can reconcile and process. We will also be looking into K8s control plane metrics which might indicate your control plane cannot keep up with the Argo Workflows workload. 

  • Workqueue depth: The workqueue depth shows workflows which have not been reconciled. If the depth starts to increase, it indicates that the Argo Workflows controller is unable to handle the submission rate of Workflows.

  • Workqueue latency: The workqueue latency is the average time workflows spent waiting in the workqueue. A lower value indicates that the Argo Workflows controller is processing workflows faster so that they are not waiting in the workqueue.

  • K8S api server requests per second: The read and write requests per second being made to the K8S api server.

We didn’t include CPU/Memory as a key metric because during our testing we did not see any significant impacts to both. Most likely because of our simplistic workflows utilized for this benchmark.

Environment

We ran the experiments in an AWS environment utilizing a single Amazon EKS cluster. The Kubernetes version is 1.27 and Argo Workflows version is 3.5.4. No resource quotas were utilized on the Argo Workflows controller. For the cluster, we will start by provisioning 1x m5.8xlarge Amazon Elastic Compute Cloud (Amazon EC2) instances which will run the Argo Workflows controller and 50x m5.large instances for executing workflows. The number of execution instances is sufficient to run all 5000 workflows in parallel to ensure that pods are not waiting on resources to execute. Monitoring and metrics for Argo Workflows were provided by Prometheus/Grafana. 

Methodology

There will be two types of load patterns evaluated:

Increasing Rate Test: Workflows will be submitted at an increasing rate (workflows/min) until the Argo Workflows controller cannot keep up. The state at which the controller cannot keep up is when there are >0 workflows in the workflow queue or there is increasing queue latency. That rate of Workflow submissions will be noted as the maximum rate at which the Argo Workflows can be processed with the current settings.

Queued Reconciliation Test: 5000 workflows are submitted in less than minute. Metrics will be monitored from when the Argo Workflows controller starts processing workflows to when it has reconciled all 5000 workflows. The number of nodes is sufficient for running all the workflows simultaneously.

Experiments

Experiment 1: Baseline

In our baseline experiment, we are running in a single Argo Workflows shard (namespace) with default settings.

Increasing Rate Test:

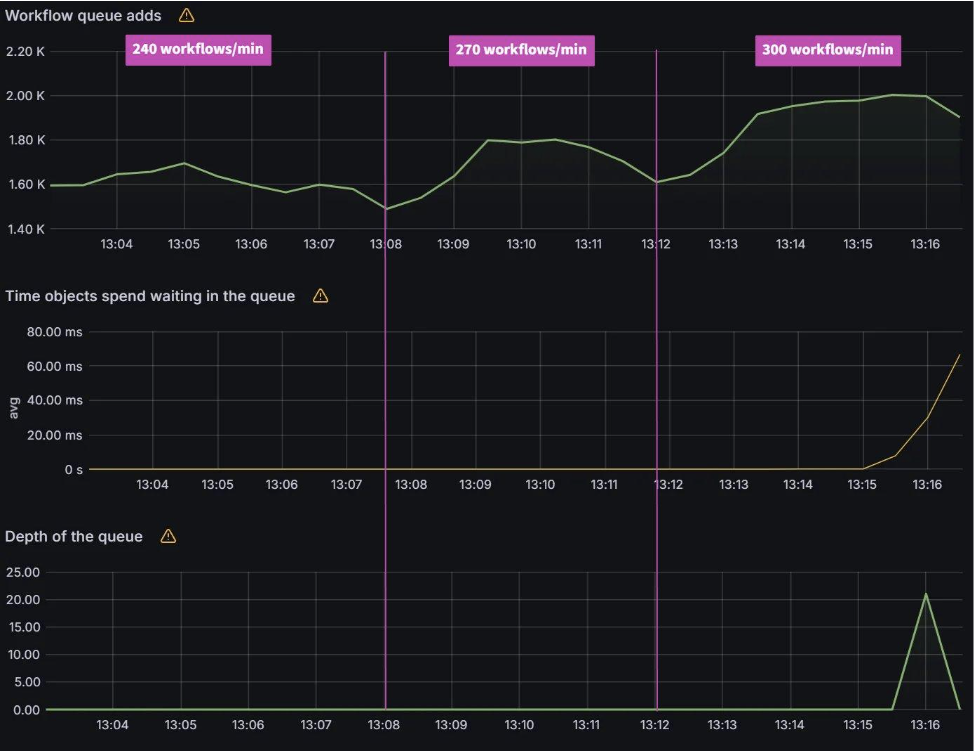
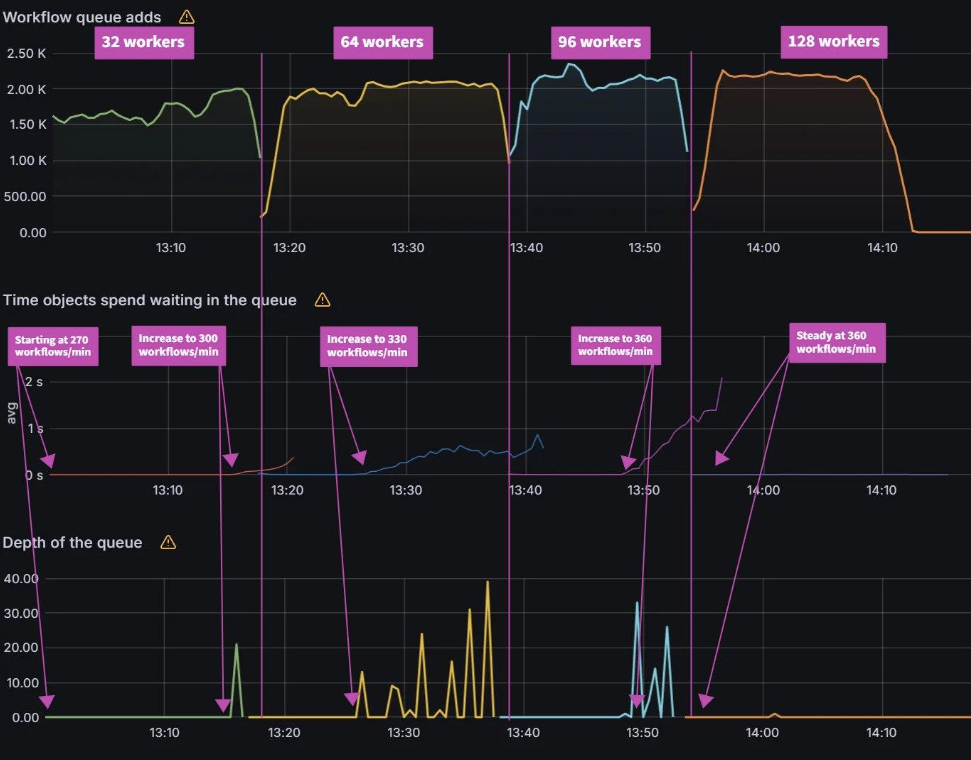
As you can see below, the Argo Workflows controller can process up to 270 workflows/min. The average workqueue latency and workqueue depth are nearly zero. At 300 workflows/min, workqueue latency and workqueue depth starts to increase.

Enter image alt description

Queued Reconciliation Test:

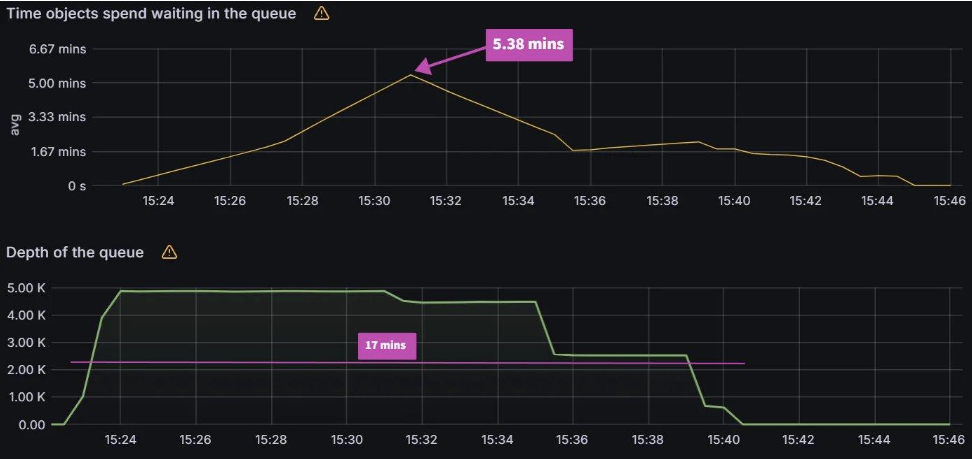
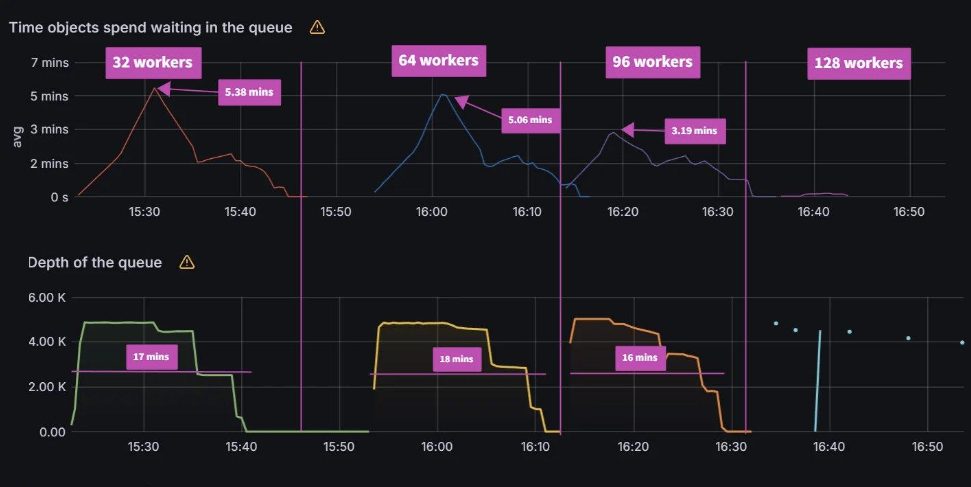
It takes around 17 mins to reconcile 5000 workflows and peak avg workqueue latency was 5.38 minutes.

Enter image alt description

Experiment 2: Workflow Workers

For this experiment, we increase the number of workflow workers from the default of 32 to 128 where the workers use the maximum QPS and burst settings available to them. We also had to increase the number of pod-cleanup-workers to 32 as the Argo Workflows controller was experiencing some instability, where the controller pod was consistently crashing with the default value of 4.

Increasing Rate Test:

For the increasing workflow rate test, we can see exactly when the number of workflow workers is not sufficient to process the load. Both workqueue latency and depth start to increase indicating that workflows are waiting to be reconciled. When we increase the number of workers, the controller is able to reconcile the current load until an additional load is placed on it. For 32 workers, that limit is 300 workflows/min. When we increase the number of workers to 64, it is able to process that load until load is increased to 330 workflows/min. Then we increase the number of workers to 96 and it can process the additional load again. When we increase to 360 workflows/min, we need to bump the number of workers to 128.

WorkersMax workflows/minute
32270
64300
96330
128360

Enter image alt description

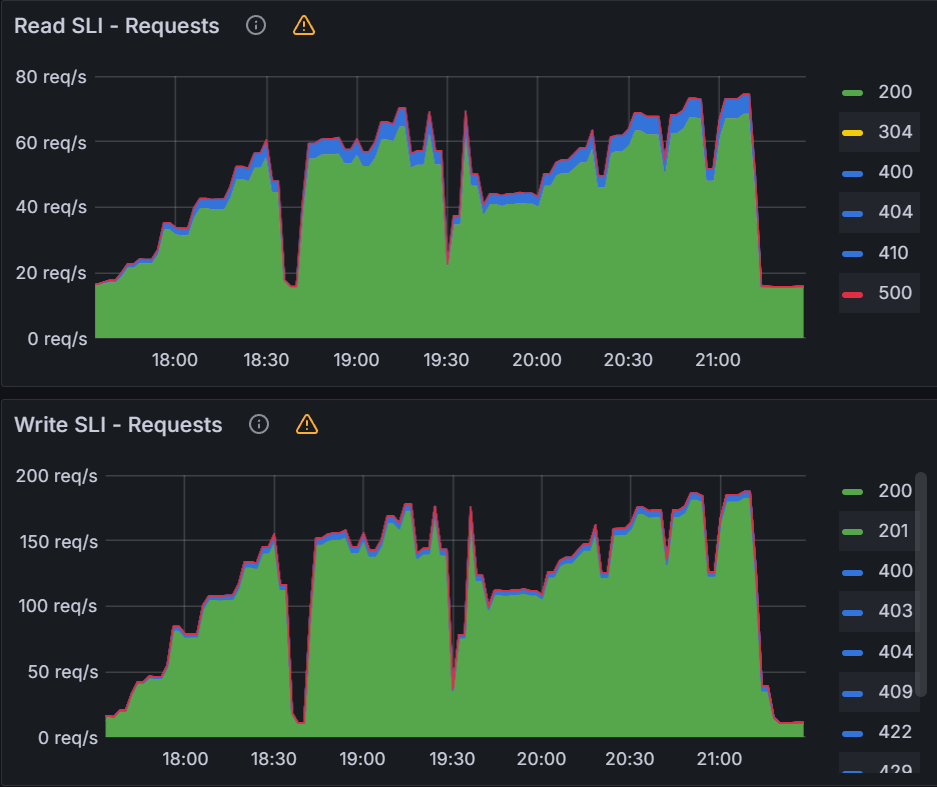
For the K8S api server, we see sustained 180 writes/sec and 70 reads/sec during the increasing rate tests.

Enter image alt description

Queued Reconciliation Test:

For the queued reconciliation test, the time it took to reconcile all the workflows did not change significantly. With 32 workers it took 17 mins to reconcile while with 96 workers it took 16 mins. The peak workqueue latency did decrease from 5.38 mins with 32 workers to 3.19 mins with 96 workers. With 128 workers, the Argo Workflows controller kept crashing.

WorkersPeak avg latency (mins)Reconcile time (mins)
325.3817
645.0618
963.1916
128N/AN/A

Enter image alt description

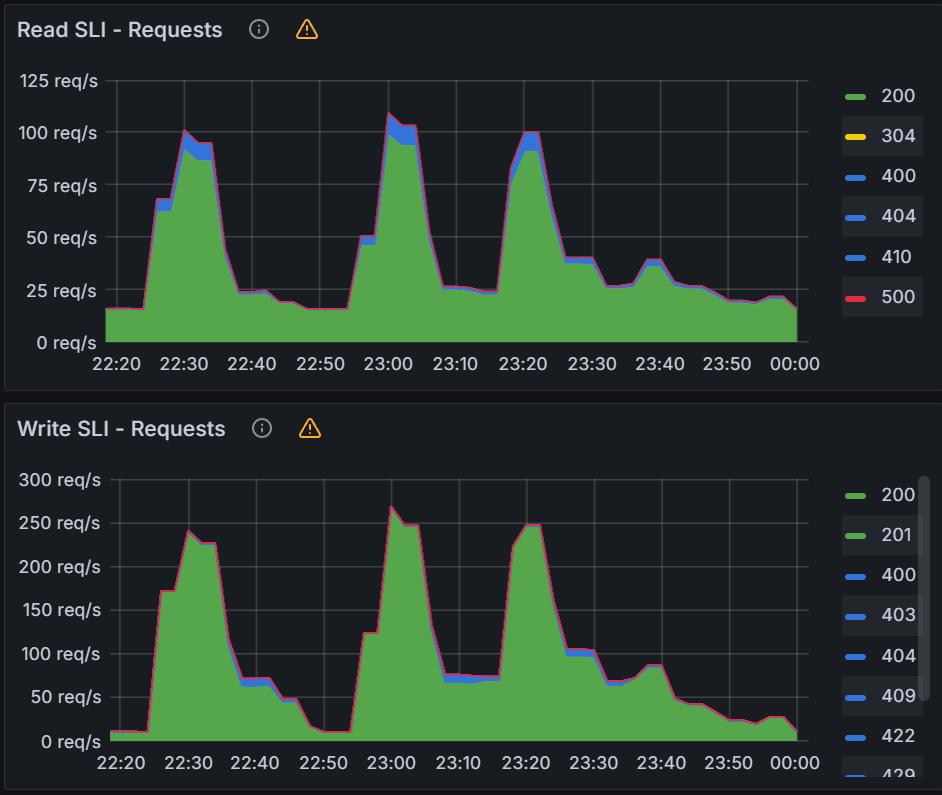
For the K8S api server, we see peaks of up to 260 writes/sec and 90 reads/sec during the queued reconciliation tests. You notice for the last test that there is no K8S api server activity as the Argo Workflows controller was misbehaving due to client-side throttling.

Enter image alt description

Observations from Experiment 2:

Workers play a big part in how fast the Argo Workflows controller is able to reconcile the rate of workflows being submitted. If you are observing workflow latency and backing up the workqueue depth, changing the number of workers is a potential way to improve performance. There are a few observations that we want to call out. One is that if we compare the two different patterns, one where we submit workflows at a constant rate and one in which we load up the workqueue all at once, we can see variations in calculated throughput. We can actually calculate the time it takes to reconcile 5000 apps utilizing the increasing rate test results and compare them to the queued reconciliation test.

WorkersIncreasing rate test time to reconciling 5000 workflows (mins)Reconcile time of 5000 workflows queued all at once (mins)
3218.517
6416.618
9615.116
12813.8N/A

We do get some conflicting results when we make this comparison. With 32 and 64 workers, the increasing rate test is actually slower than the queued reconciliation test. But if we increase to 96 workers, we can see that the increasing rate test results are faster. We were unable to compare with 128 workers as the Argo Workflows controller crashed when trying to run the queued reconciliation test. When investigating the cause of the crash, the logs have several messages like the following:

Waited for 6.185558715s due to client-side throttling, not priority and fairness, request: DELETE:https://10.100.0.1:443/api/v1/namespaces/argoworkflows1/pods/hello-world-57cfda8a-dc8b-4854-83a0-05785fb25e4b-3gwthk

These messages indicate that we should increase the Client QPS settings which we will evaluate in the next experiment.

Experiment 3: Client QPS Settings

For this experiment, we set the number of workflow workers back to the default of 32. We will then increase the QPS/Burst by increments of 10/10, from 20/30 to 50/60. We chose to only increase by 10/10 because any large increase past 50/60 did not yield any performance improvements. We believe that this is partly because we kept the workers at 32.

Initial Testing

Increasing Rate Test:

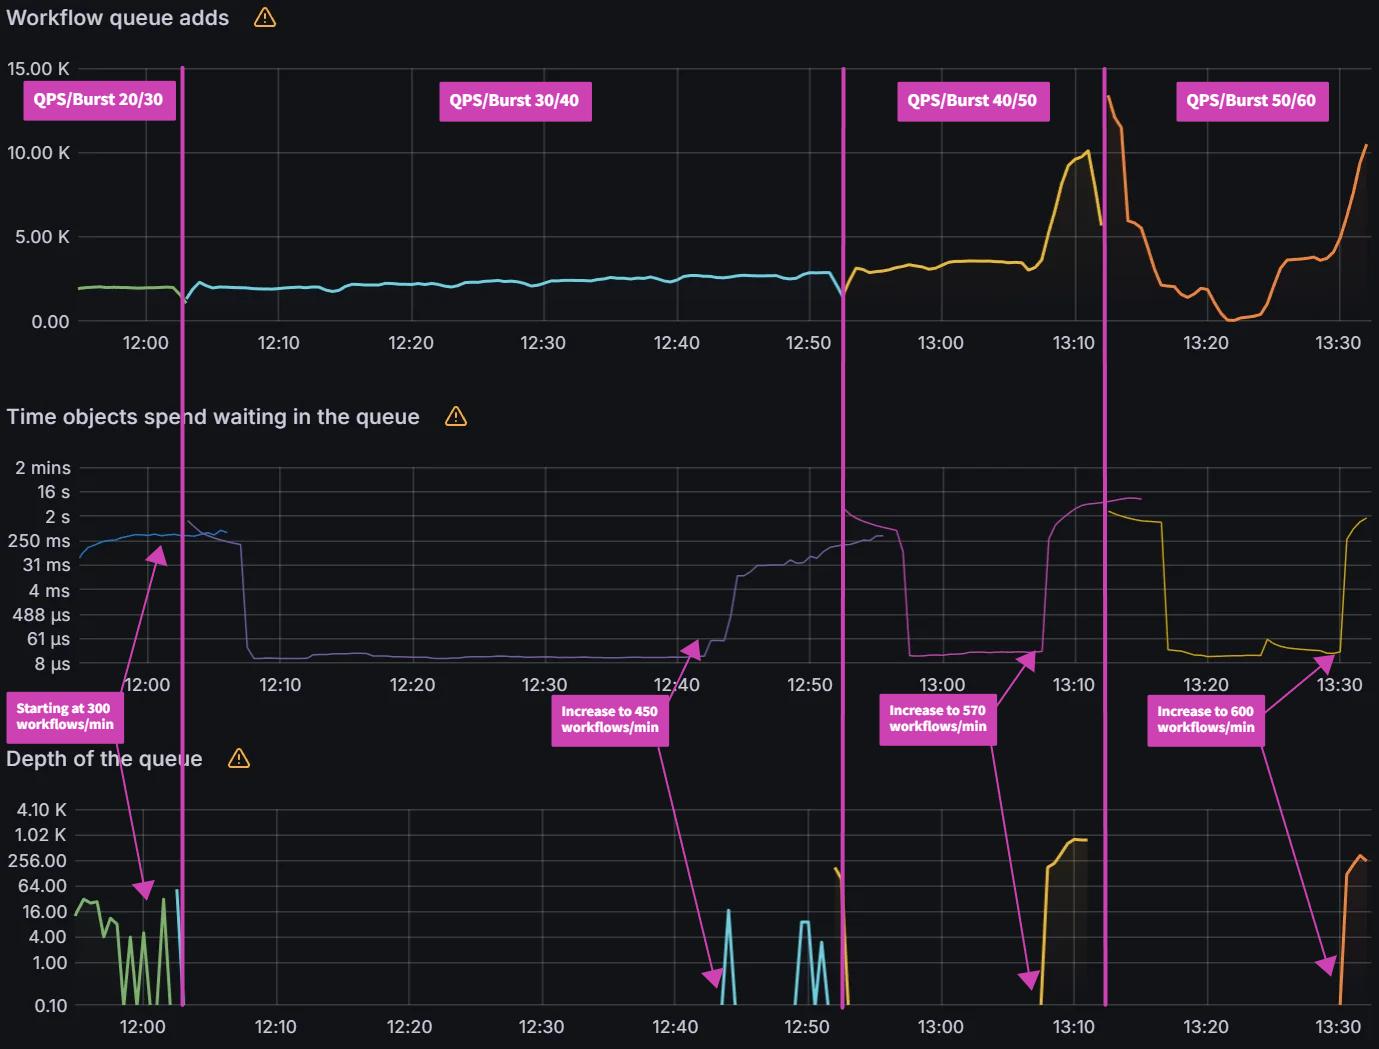
The QPS/Burst settings had a significant impact on the increasing rate test. By increasing the QPS/Burst from 20/30 to 30/40, we see ~50% improvement in max workflows/min from 270 to 420. When we increase the QPS/Burst from 30/40 to 40/50, we see another 28% improvement in max workflows/min from 420 to 540. When increasing from 40/50 to 50/60 there was only an additional 5% improvement. For 32 workers, increasing past 50/60 did not yield any significant improvements to the max workflows/min.

QPS/BurstMax workflows/minute
20/30270
30/40420
40/50540
50/60570

Enter image alt description

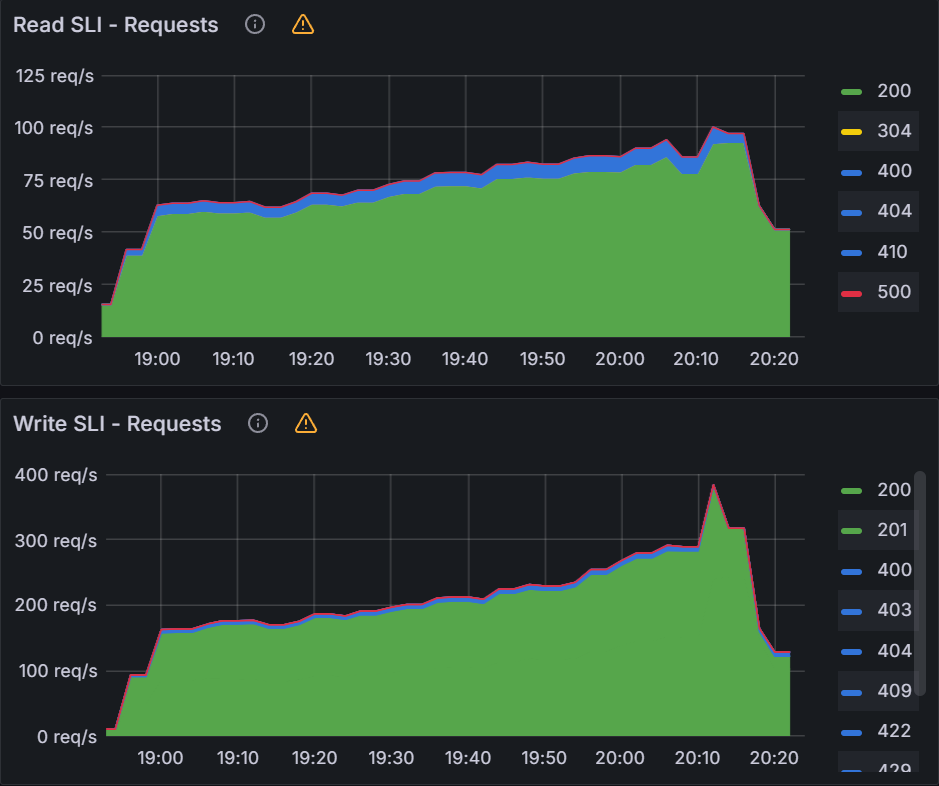
When changing QPS/Burst, we need to also monitor the K8S API server. Looking at the K8S API server req/s, we see sustained 390 writes/sec and 85 read/sec.

Enter image alt description

Queued Reconciliation Test:

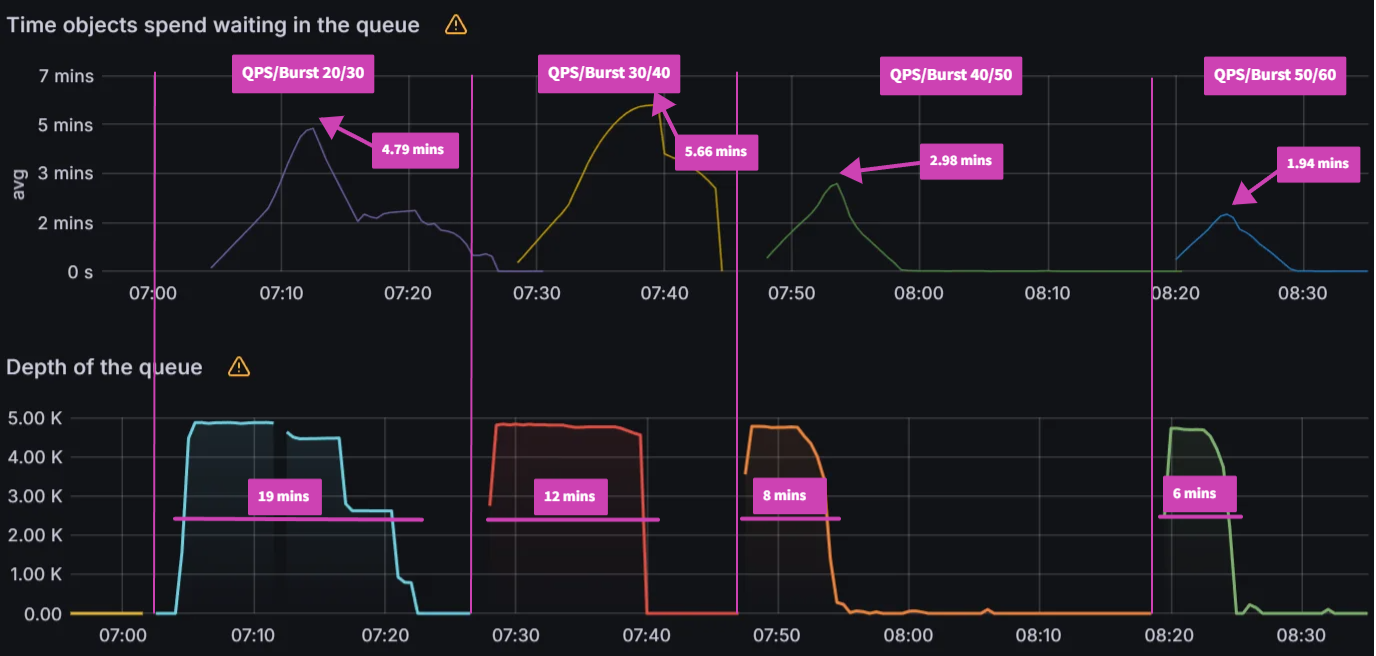
Again, the QPS/Burst settings make a big difference in the queued reconciliation test when compared to just changing the workflow workers. Starting from the default settings of 20/30, we see decreasing reconcile times from 19 mins to 12 mins to 8 mins and finally to 6 mins when setting the QPS/Burst to 50/60. The peak average latency also decreased from 4.79 mins to 1.94 mins. We did note that there was a higher peak avg latency with 30/40 vs 20/30 but if you examine the graph you can see a steeper drop in latency accounting for the shorter reconcile time. Similar to the increasing rate test, increasing the QPS/Burst further did not yield any improvements.

QPS/BurstPeak avg latency (mins)Reconcile time (mins)
20/304.7919
30/405.6612
40/502.988
50/601.946

Enter image alt description

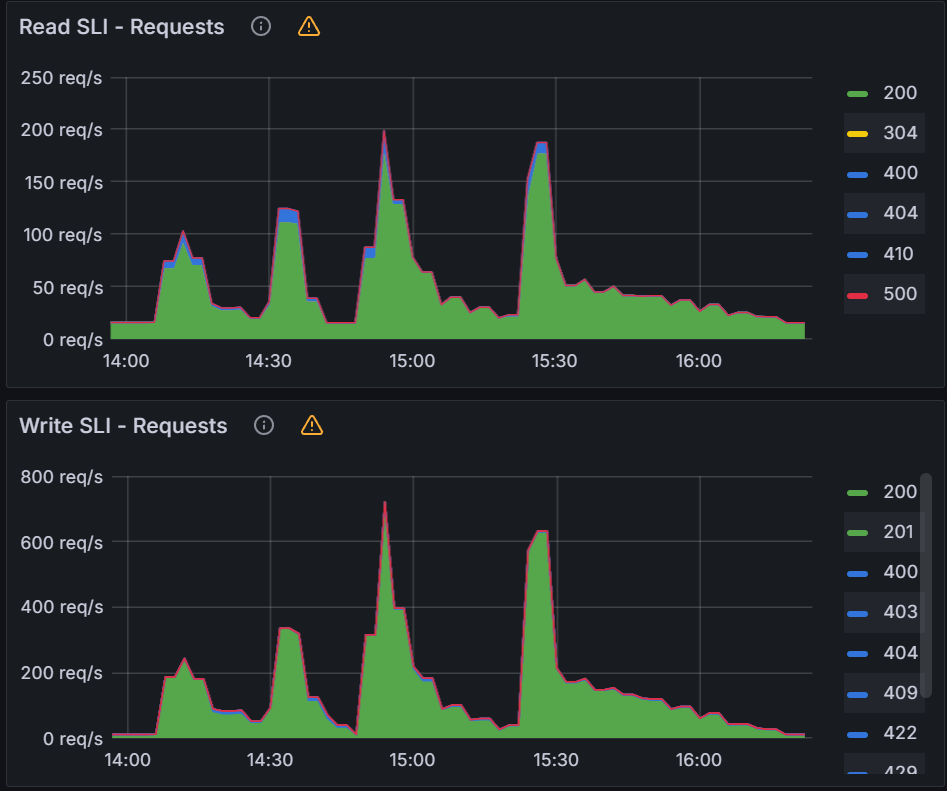
When looking at the K8S API server, we see peaks of up to 700 writes/sec and 200 reads/sec during the tests.

Enter image alt description

When compared to the workflow workers testing, you can see increasing the QPS/Burst is able to push the K8S API server and improve Argo Workflows overall performance. We do see some diminishing returns when increasing QPS/Burst past 50/60 even though it appears that the K8S API server has plenty of capacity for additional load. For the next test, we will increase both the workflow workers with the QPS/burst to see how far we can push Argo Workflows and the K8s API server.

Max Load Test

Increasing Rate Test:

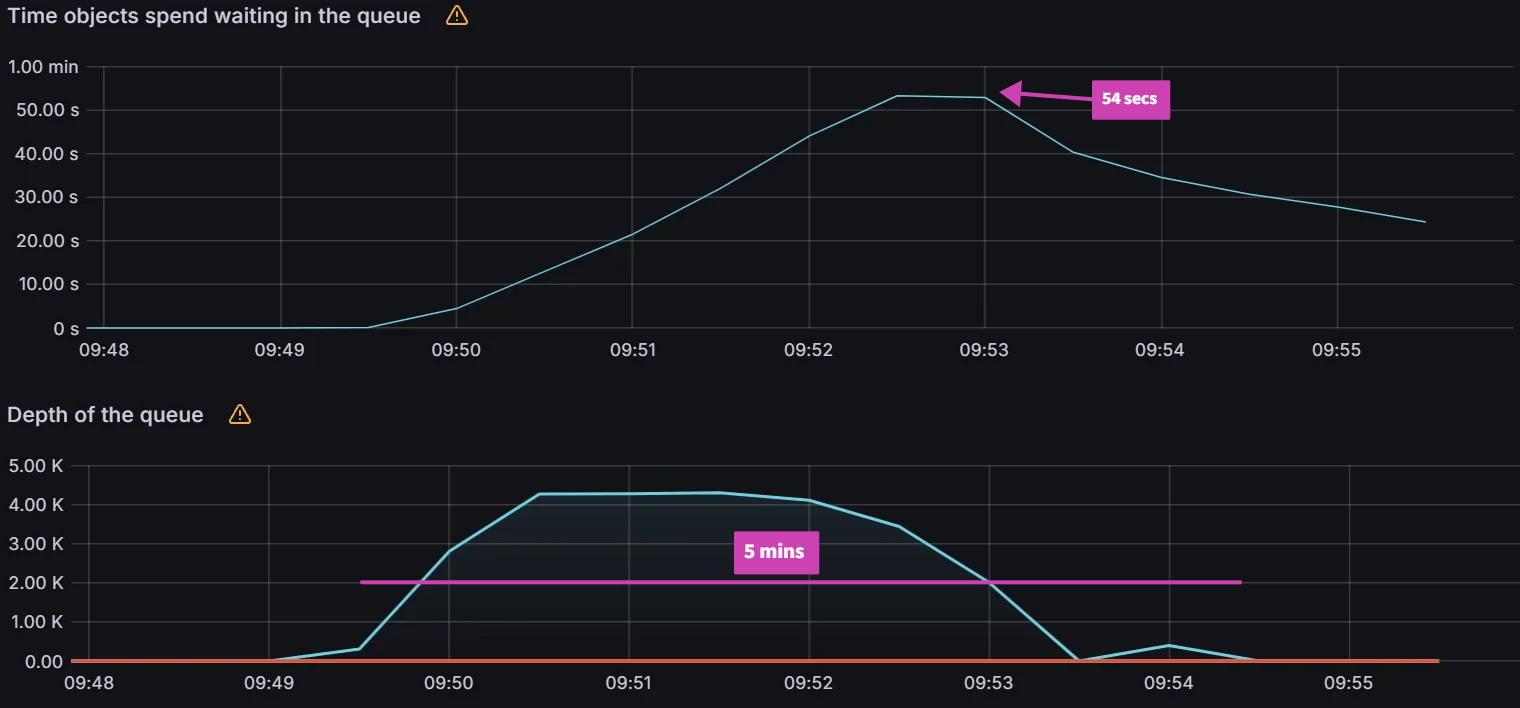
We increased the number of workers to 128 and QPS/burst to 60/70 and observed peak average latency of 54 secs and a reconciliation time of 5 mins. Increasing either the workers or QPS/Burst did not improve these numbers.

Enter image alt description

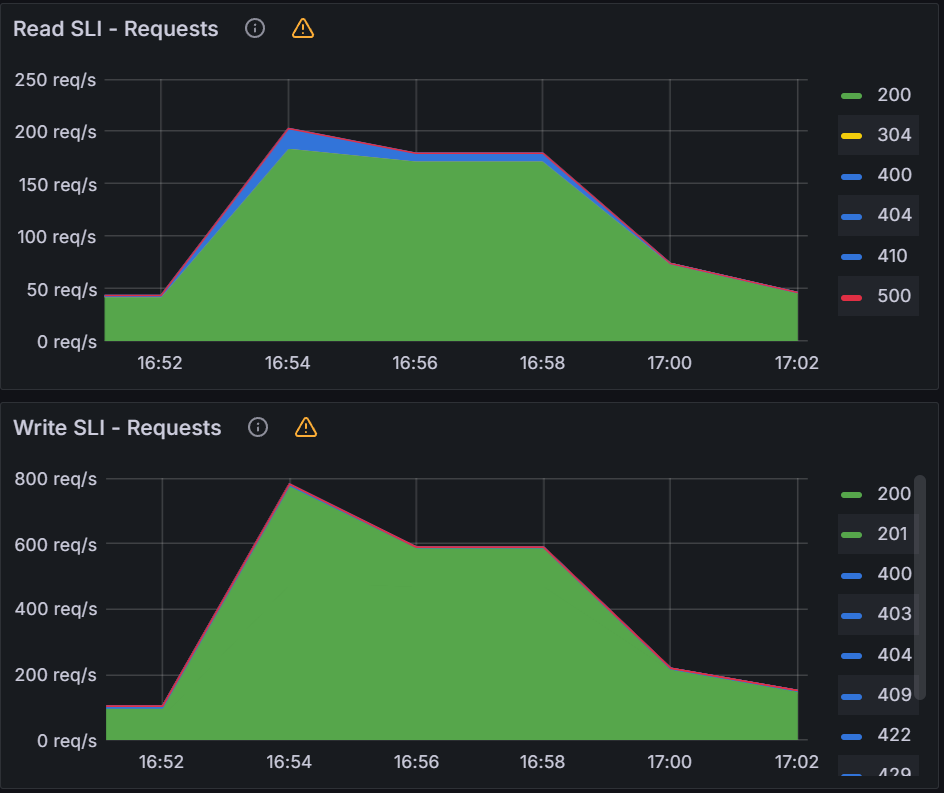
Looking at the K8s API server, we saw peaks of 800 writes/sec and 190 reads/sec.

Enter image alt description

Queued Reconciliation Test:

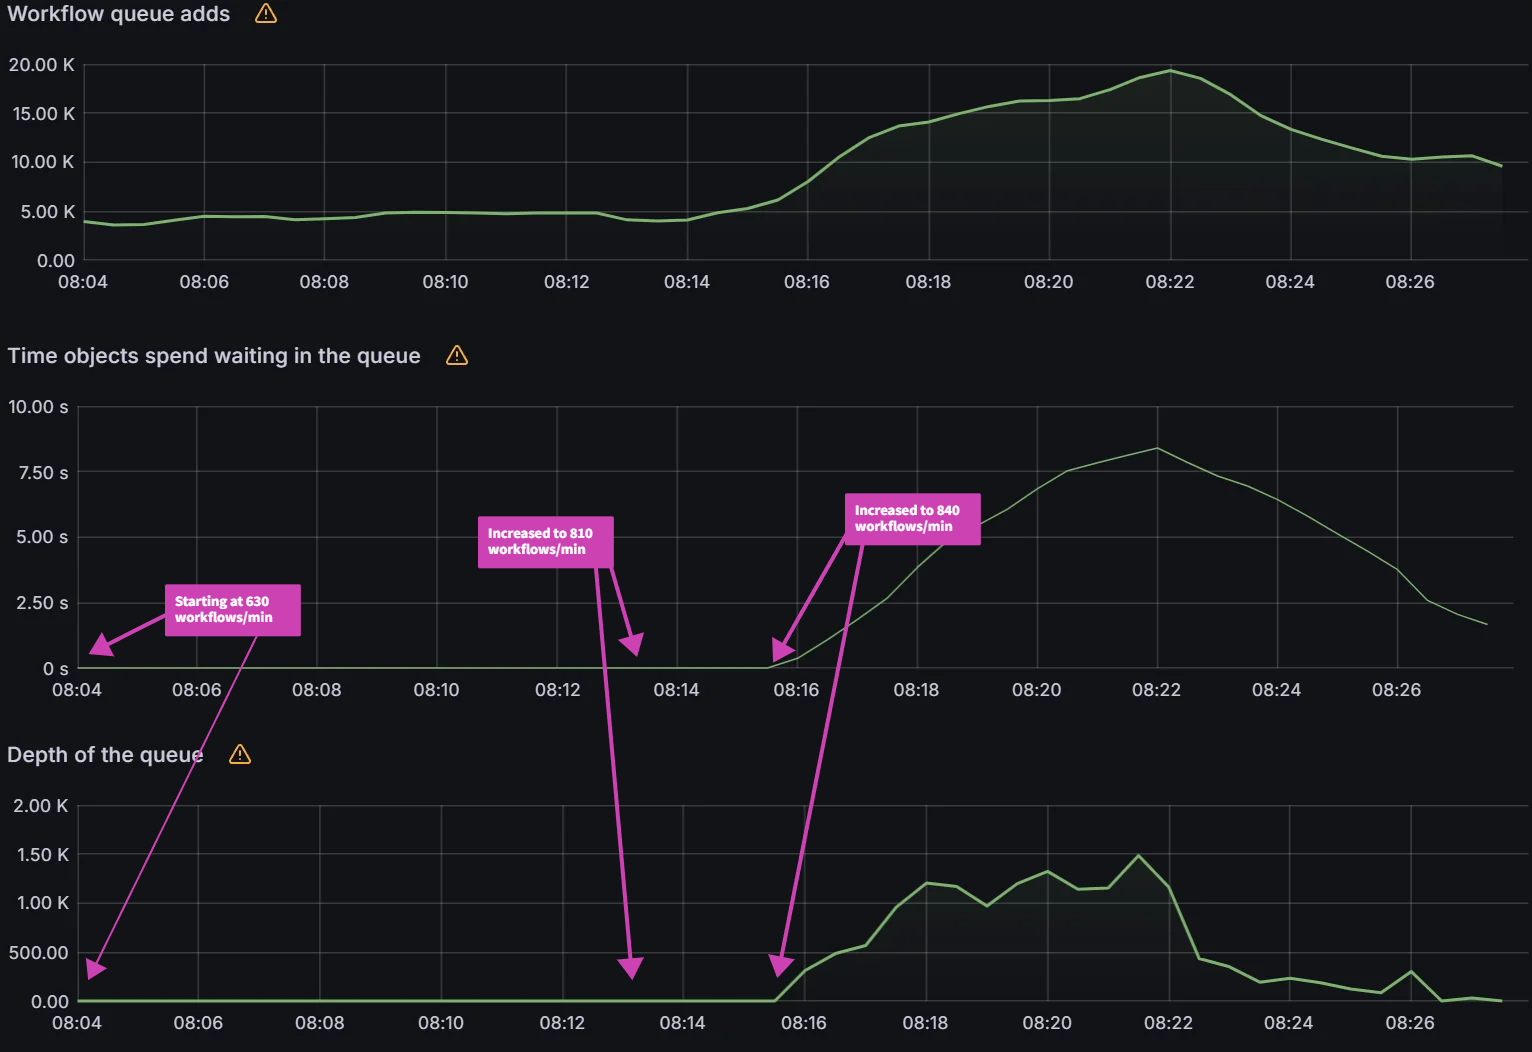
Starting with 128 workers and QPS/Burst of 60/70, we were able to push Argo Workflows to 810 workflows/min. But past that point, there were no improvements with more workers or increased QPS/Burst limits.

Enter image alt description

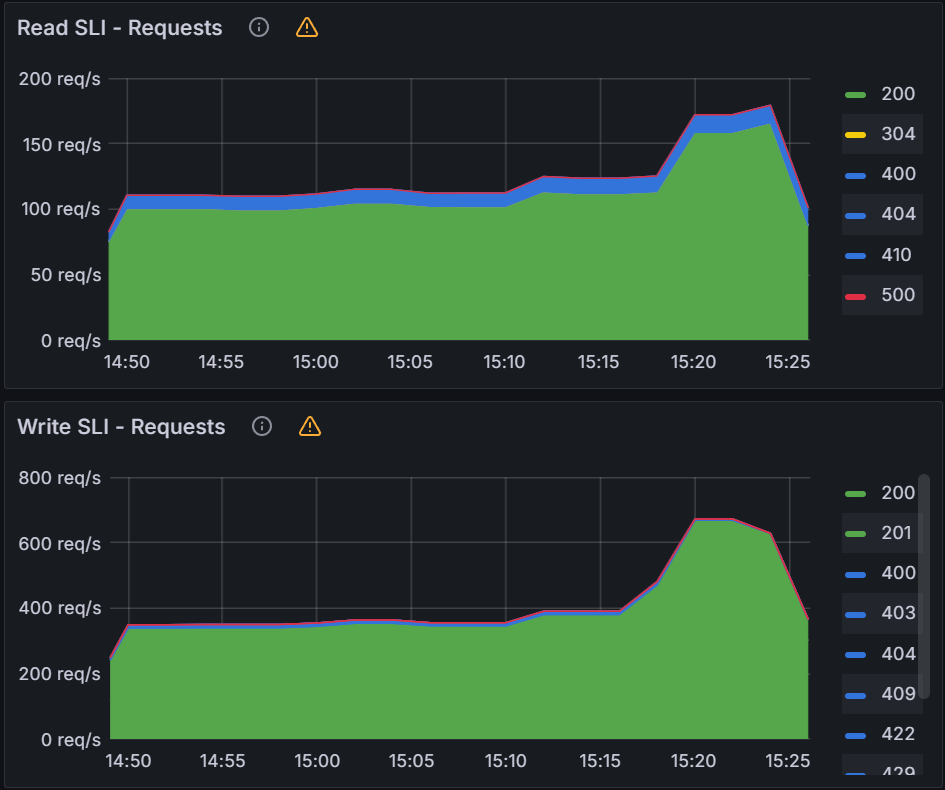
We can see increased K8s API server activity with sustained 700 writes/sec and 160 reads/sec.

Enter image alt description

Observations from Experiment 3

One observation we made in the previous experiment with workflow workers is that the two different patterns of submitting workflows can be compared. We made that comparison again with the QPS/Burst tests and saw the following results:

QPS/BurstWorkersIncreasing rate test time to reconcile 5000 workflows (mins)Reconcile time of 5000 workflows queued all at once (mins)
20/303218.519
30/403211.912
50/60329.28
60/70328.76
70/801286.15

When we take the data about the comparison in experiment 1 with the data above, we can see a slight improvement in submitting all workflows together vs staggering them. We are not sure why this is the case and more experiments are required to understand this behavior.

It seems that we have hit a wall with 128 workers and a QPS/burst of 60/70 for a single Argo Workflows Controller. We will now evaluate Sharding and see if we can improve our performance from this point.

Experiment 4: Sharding

For this experiment, we will evaluate 1 shard, 2 shards, and 5 shards of the Argo Workflows controller with the default settings. We will then try for a maximum load test utilizing workflow workers, QPS/burst, and sharding to see the maximum performance on our current infrastructure.

Initial Testing

Increasing Rate Test:

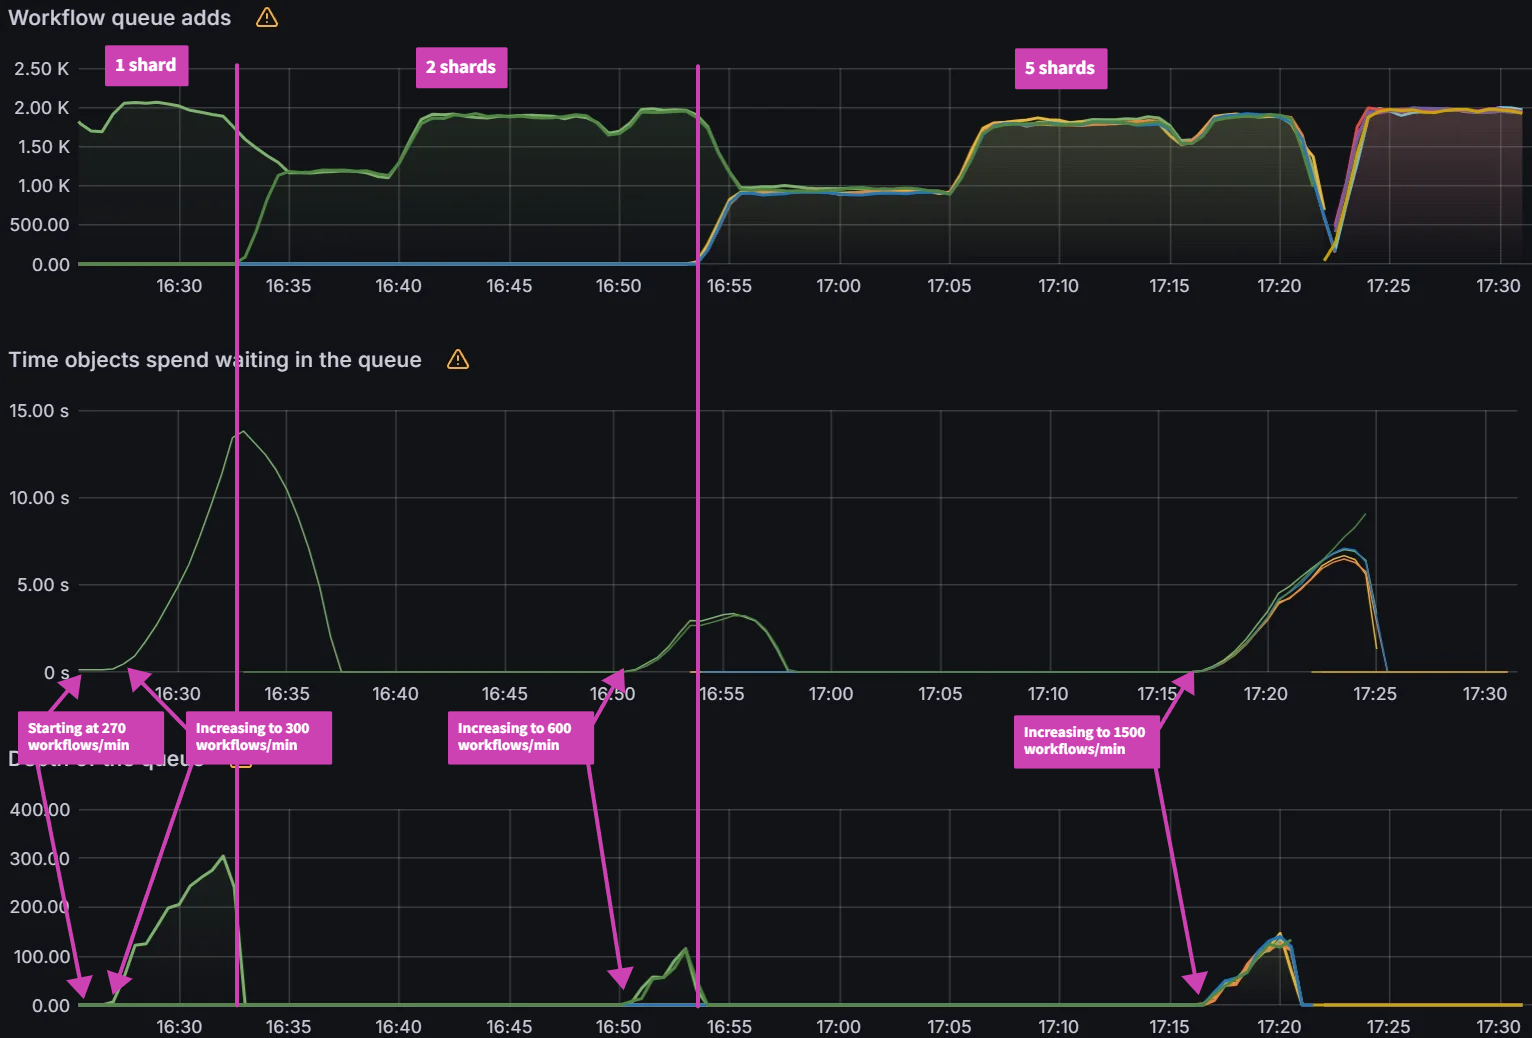
Sharding the Argo Workflows controller has a linear impact on performance with the increasing rate test. By increasing the number of shards from 1 to 2, we see a 100% improvement in max workflows/min from 270 to 540. When we increase the shards from 2 to 5, we see an additional 150% improvement in max workflows/min from 540 to 1350.

ShardsMax workflows/min
1270
2540
51350

One thing to note is that each shard is increased by 30 workflows/min when increasing the rate. This means that the difference between two rates with 2 shards 30 = 60 workflows/min and the difference between two rates with 5 shards 30 = 150 workflows/min. That is why for 2 shards when the max load was determined at 600 workflows/min, we go down 1 rate which is 600 - 60 = 540 workflows/min.

Enter image alt description

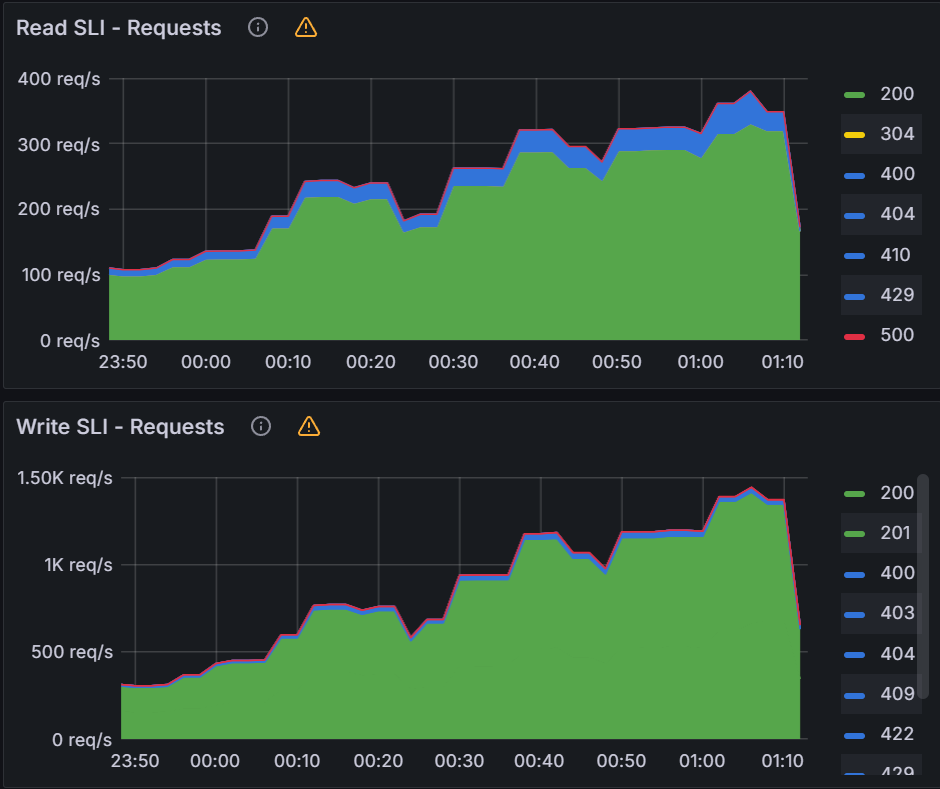
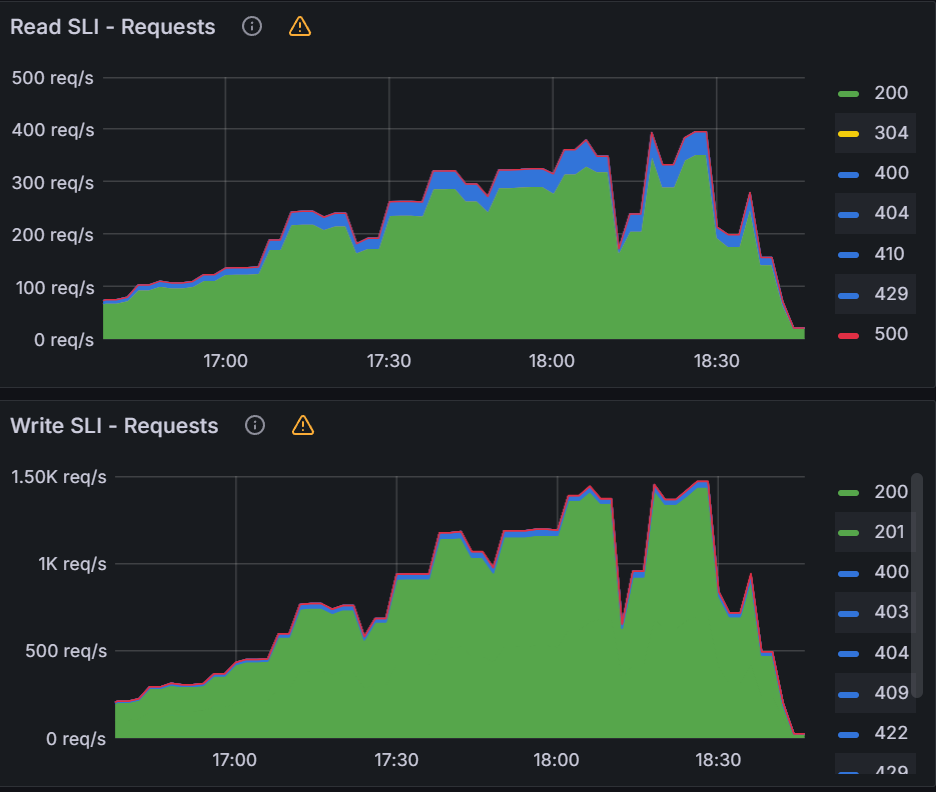
You can see a significant impact on the K8s API server with sustained 1400 writes/sec and 300 reads/sec.

Enter image alt description

Queued Reconciliation Test:

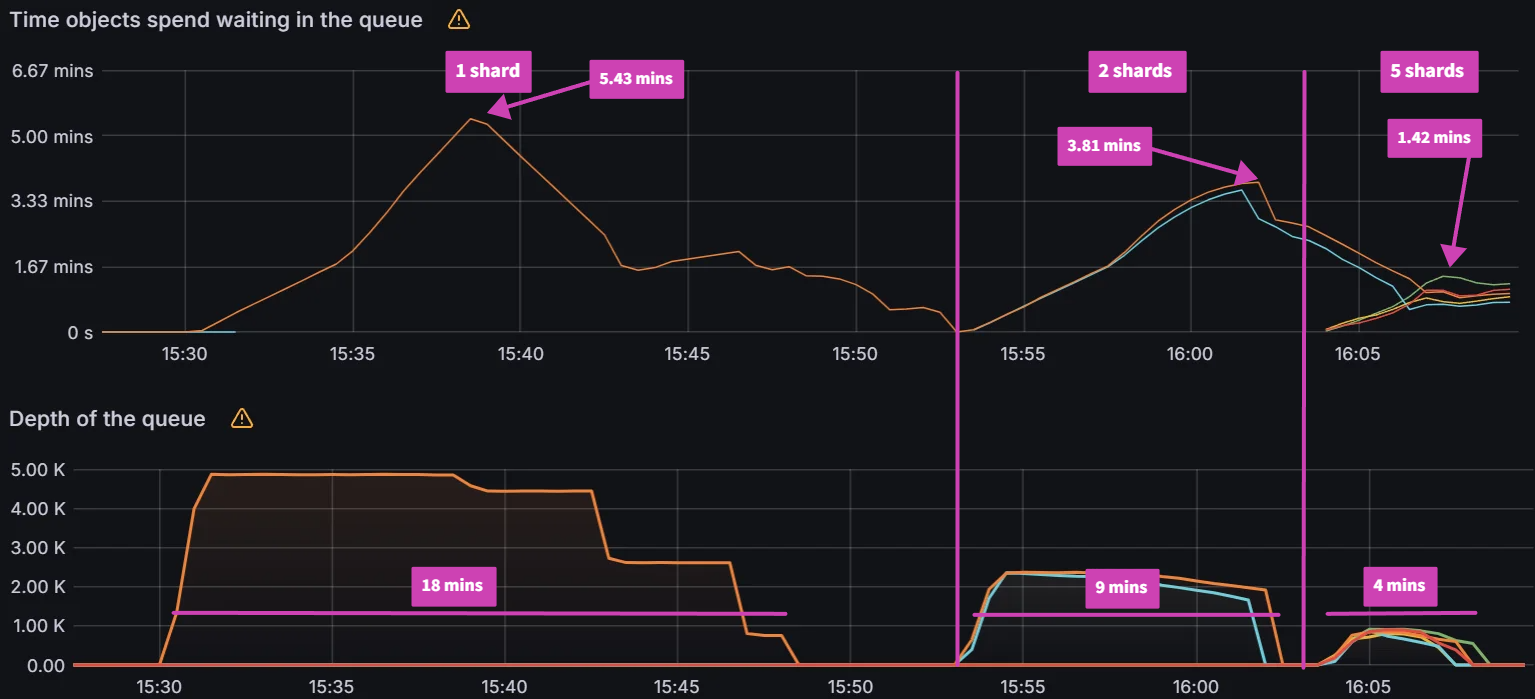
As shown in the Increasing Rate Test, sharding has a huge impact on performance for the queued reconciliation test. With 1 shard it takes 18 mins to reconcile 5000 workflows, while with 2 shards it takes 9 mins. With 5 shards the reconcile time is further reduced to 4 mins.

ShardsPeak avg latency (mins)Reconcile time (mins)
15.4318
23.819
51.424

Enter image alt description

The impact on the K8s API server was not as significant when compared to previous experiments.

Max Load Test

Increasing Rate Test:

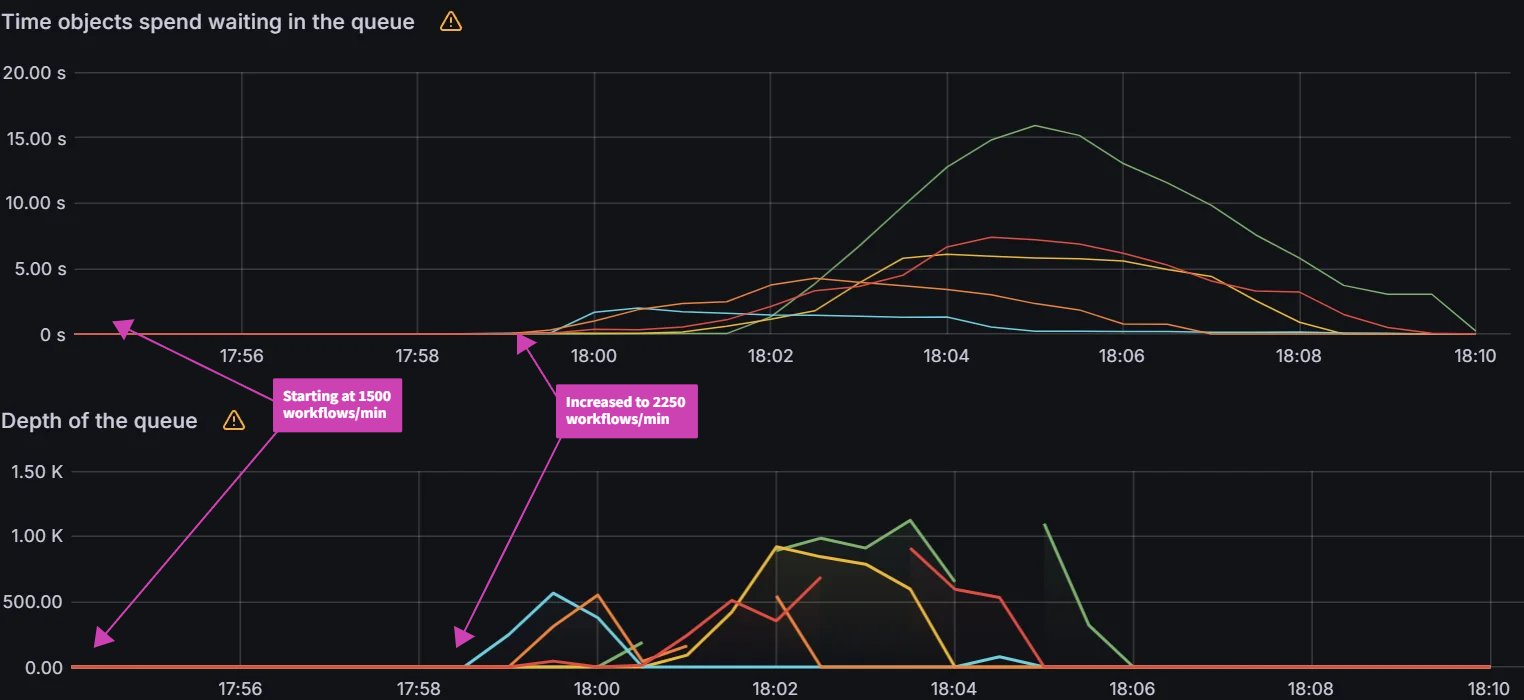
When increasing the workflow workers to 128, QPS/burst to 60/70 and shards to 5, the Argo Workflows controller is able to process up to 2100 workflows/min. Any higher than this seems to run into K8s API Priority and Fairness (APF) limits.

Enter image alt description

When looking at the K8s API server, we are seeing significant impact with peaks of 1500 writes/sec and 350 reads/sec.

Enter image alt description

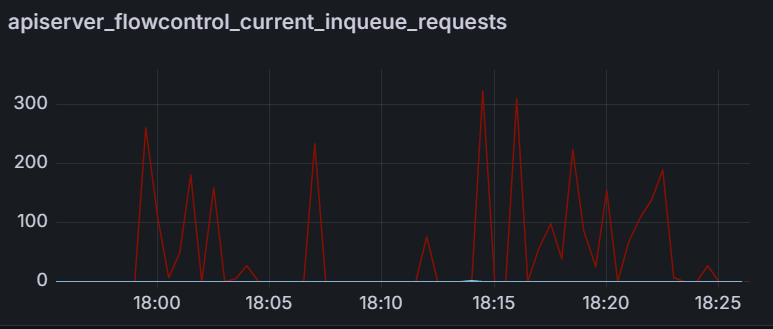
When investigating why we are unable to push higher on the K8s API server, we see that APF limits are coming into effect by looking at the apiserver_flowcontrol_current_inqueue_requests. This metric shows the number of requests waiting in the APF flowcontrol queue.

Enter image alt description

Queued Reconciliation Test:

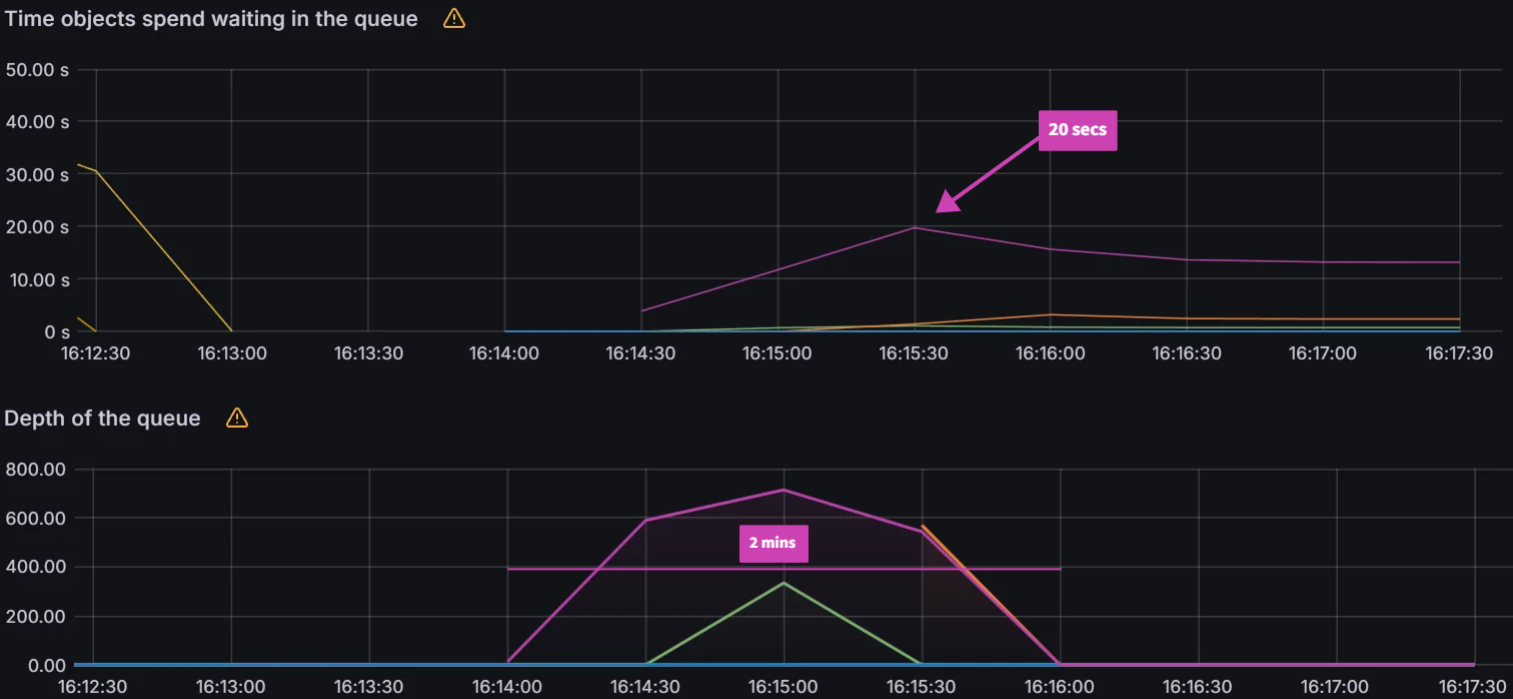
With the max load settings, we observed that the peak workqueue latency is only 20 seconds and the reconcile time is 2 minutes.

Enter image alt description

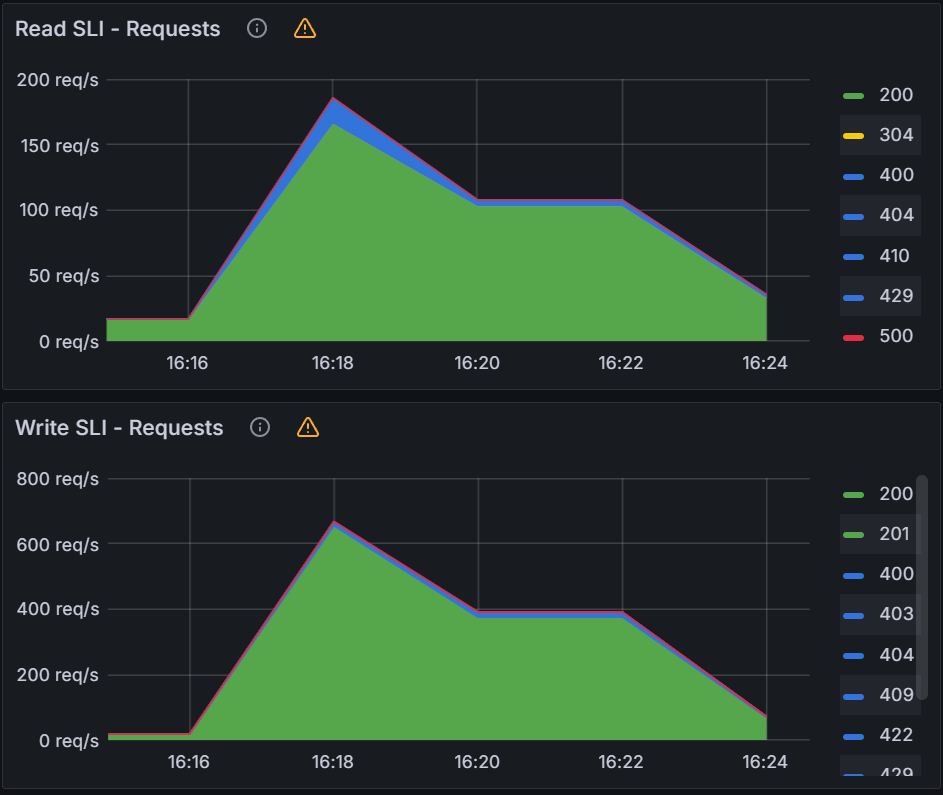
The impact on K8s API server is actually less than the previous max load queued reconciliation tests.

Enter image alt description

Observations from Experiment 4

As we did in previous experiments, we again make the comparison between the two different load patterns:

ShardsIncreasing rate test time to reconcile 5000 workflows (mins)Reconcile time of 5000 workflows queued all at once (mins)
118.518
29.29
53.74
Max load (5 shards)2.32

In general, it appears that submitting all workflows at once performs slightly better than submitting workflows at a steady rate. More experiments will need to be done to further investigate this behavior.

Conclusion

In this blog post we discussed our initial efforts in documenting and understanding the scaling characteristics of the Argo Workflows controller. Our findings show that the existing mechanisms for increasing workflow workers, increasing client and burst QPS settings and sharding the controller can help Argo Workflows scale better. Another interesting observation is that we saw differences in performance with how you submit your workflows. For the next set of experiments, we plan to evaluate more environmental variables and different types of workflows: multi-step and/or long running. Stay tuned for the report on our next round of experiments and reach out on the CNCF #argo-sig-scalability Slack channel to get help optimizing for your use-cases and scenarios.

· 21 min read
Andrew Lee
Michael Crenshaw
Gaurav Dhamija

Introduction

In Part 1 of our Argo CD benchmarking blog post, we analyzed the impacts of various Argo CD configuration parameters on the performance of Argo CD. In particular we measured the impact of status and operation processes, client QPS, burst QPS, and sharding algorithms on the overall synchronization and reconciliation behavior in Argo CD. We showed that using the right configuration and sharding strategy, particularly by properly setting client and burst QPS, as well as by splitting the workload across multiple workload clusters using Argo CD sharding, overall sync time can be improved by a factor of 4.

Here, and in Part 2 of our scalability work, we push our scalability experiments for Argo CD further. In particular, among other tests, we run our scalability metrics against a maximum of 500 workload clusters, deploying 50,000 Argo applications. This, to the best of our knowledge, sets the largest scalability testing ever done for Argo CD. We also report on a much deeper set of sharding experiments, utilizing different sharding algorithms for distribution of load across 100 workload clusters. While we report on running our experiments against a legacy sharding algorithm and a round robin algorithm that already exist in Argo CD 2.8, we also discuss results of workload distribution using 3 new sharding algorithms we developed in collaboration with RedHat, namely: a greedy minimum algorithm, a weighted ring hash algorithm, and a consistent hash with bounded loads algorithm. We show that, depending on the optimization goals one has in mind, choosing from the new sharding algorithms can improve CPU utilization by a factor of 3 and reduce application-to-shard rebalancing by a factor of 5, significantly improving the performance of a highly distributed and massively scaled Argo CD deployment.

Experiment 1: How Client QPS/Burst QPS affects the Kubernetes API Server

Objective:

The objective of the first experiment is to understand the impact of QPS & Burst Rate parameters on 1/Kubernetes control plane for both the Argo CD cluster and the remote application clusters, and 2/ overall sync duration for Argo CD applications. To understand the impact on Kubernetes API server, we observed following control plane metrics:

  • Latency (apiserver_request_duration_seconds_bucket)
  • Throughput (apiserver_request_total)
  • Error Rate (apiserver_request_total{code=~"[45].."}) for any request returning an error code 4xx or 5xx.

To analyze impact on application synchronization, we observed Sync Duration and No. of Goroutines Argo CD server metrics.

Test Infrastructure:

In terms of test infrastructure and workload configuration, we had one central Amazon EKS cluster with Argo CD Server running on it. This central cluster connected with three remote Amazon EKS clusters with each one of them hosting 5000 Argo CD applications. Each application is a Configmap (2KB) provisioned in a dedicated namespace. All of the four clusters, one central and three remote, had a dedicated monitoring stack composed of Prometheus and Grafana installed on them.

Observations:

Observation 1 - Impact on Argo CD application synchronization

The table and graphs below highlight the impact of QPS & Burst Rate on “Sync Duration” as well as the average and maximum no. of goroutines active during the test run.

QPSBurst RateSync DurationNo. of GoRoutines (Avg)No. of GoRoutines (Max)
5010061.5 mins17601810
10020029.5 mins21202310
15030019.0 mins25202760
20040018.0 mins26202780
25050017.5 mins25902760
30060018.0 mins25402760

alt_text

To summarize, during the test, we immediately observed ~52% reduction (from 61.5 mins to 29.5 mins) as we increased QPS & Burst Rate from default values to 100 & 200 respectively. This also correlated with corresponding increase in no. of Goroutines processing application synchronization requests. The benefit from increasing values of these parameters started providing diminishing returns with subsequent runs. Beyond QPS & Burst rate of 150 & 300 respectively, there wasn’t measurable improvement observed. This again correlated with number of Goroutines actively processing sync requests.

Observation 2 - Impact on central Amazon EKS cluster control plane hosting Argo CD Server

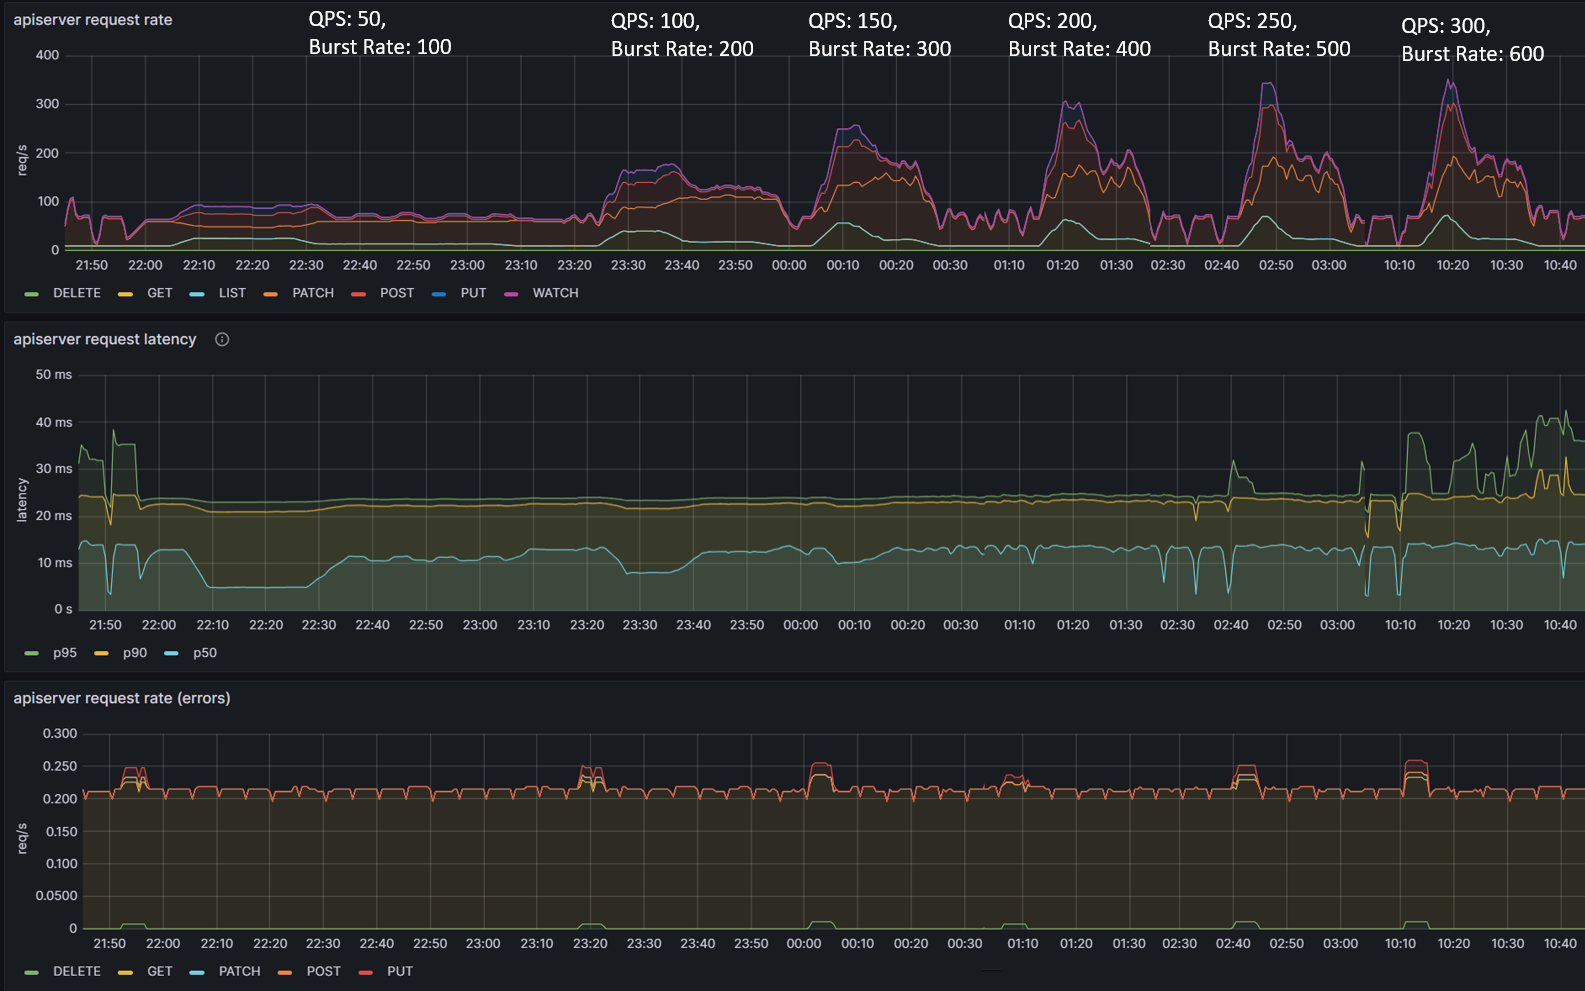
The table and graphs below highlights the impact of QPS & Burst Rate on throughput and latency from Amazon EKS control plane hosting Argo CD Server. We can observe an increase in request rate per second to the Kubernetes control plane which is in line with previous observations related to increase in no. of goroutines processing the sync requests. The increased activity related to sync operations translates into increased requests to Amazon EKS control plane tapering off at QPS of 150 and Burst Rate of 300. Additional increase in QPS and Burst Rate parameters doesn’t noticeably impact request rate per second.

QPSBurst RateRequest Rate (Max)Latency p50 (Max)Latency p90 (Max)
5010027.2 rps13.0 ms22.6 ms
10020031.9 rps13.3 ms23.1 ms
15030039.8 rps14.3 ms24.0 ms
20040041.4 rps14.9 ms24.4 ms
25050039.0 rps15.1 ms24.4 ms
30060040.7 rps16.4 ms34.5 ms

From a latency perspective, overall during the course of testing, average (p50) duration remained within range of 13 to 16.5 ms and p90 latency within 22 ms to 34 ms. The error rate remained consistently around ~0.22% with a brief spike to ~0.25% (increase of ~0.03%).

The relatively low latency numbers and low error rate (<0.25%) indicates that Amazon EKS control plane was able to handle the load comfortably. Increasing QPS and Burst rate only would stretch the control plane to a limited extent indicating it still has resources to process additional requests as long as Argo CD server can generate request traffic.
alt_text

Observation 3 - Impact on remote Amazon EKS cluster control plane hosting applications

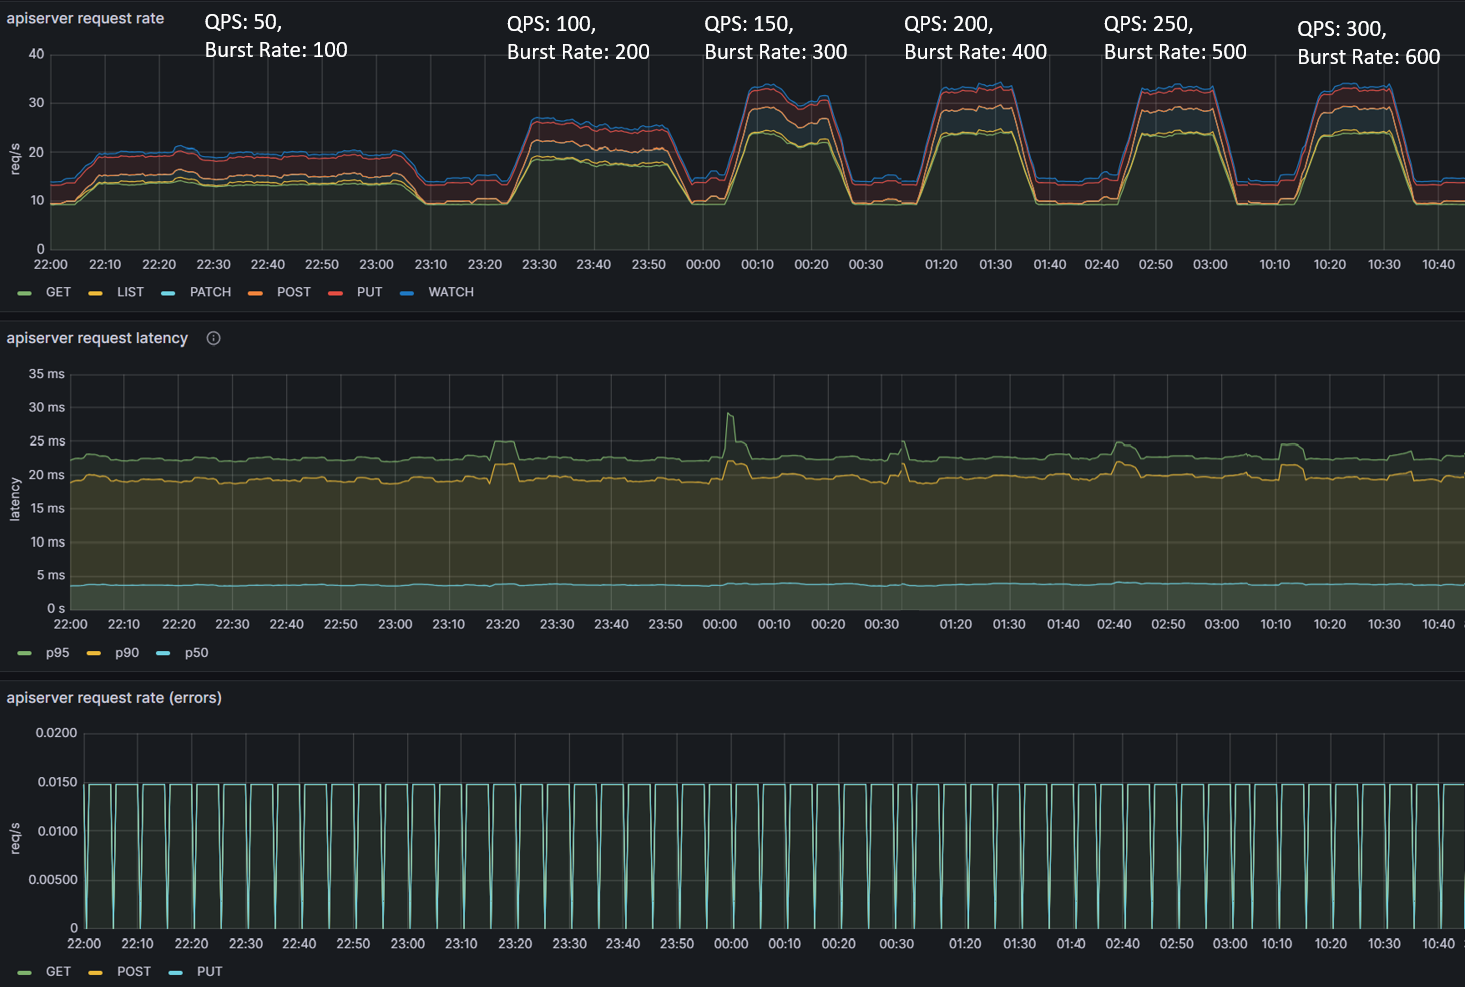
We had similar observations regarding latency, throughput and error rate for Amazon EKS control plane of remote application clusters. These are the clusters hosting ~5000 Argo CD applications each and connected to Argo CD Server on the central Amazon EKS cluster. The throughput peaked at ~35 requests per second with QPS and burst rate of 150 & 300 respectively. From an average latency perspective, it remained consistently within single digit millisecond hovering around ~5ms.
alt_text

Experiment 2: Revisiting Status/Operation Processors

Objective:

The objective of the second experiment is to explore why status/operation processors did not have an effect on sync times of our previous experiments. It is possible that the simple nature of ConfigMap applications which takes <1s to deploy is causing this behavior. Most real world applications would consist of tens to hundreds of resources taking longer to be deployed. During this experiment, we will simulate a more complex application which takes longer to deploy than the original ConfigMap application.

Test Infrastructure:

Central Argo CD cluster running on a single m5.2xlarge managing 100 application clusters. In order to simulate larger applications, each application will execute a PreSync job which waits 10 seconds before deploying the original ConfigMap application.

Example of the PreSync Job:

apiVersion: batch/v1
kind: Job
metadata:
name: before
annotations:
argocd.argoproj.io/hook: PreSync
argocd.argoproj.io/hook-delete-policy: HookSucceeded
spec:
template:
spec:
containers:
- name: sleep
image: alpine:latest
command: ["sleep", "10"]
restartPolicy: Never
backoffLimit: 0

Observations:

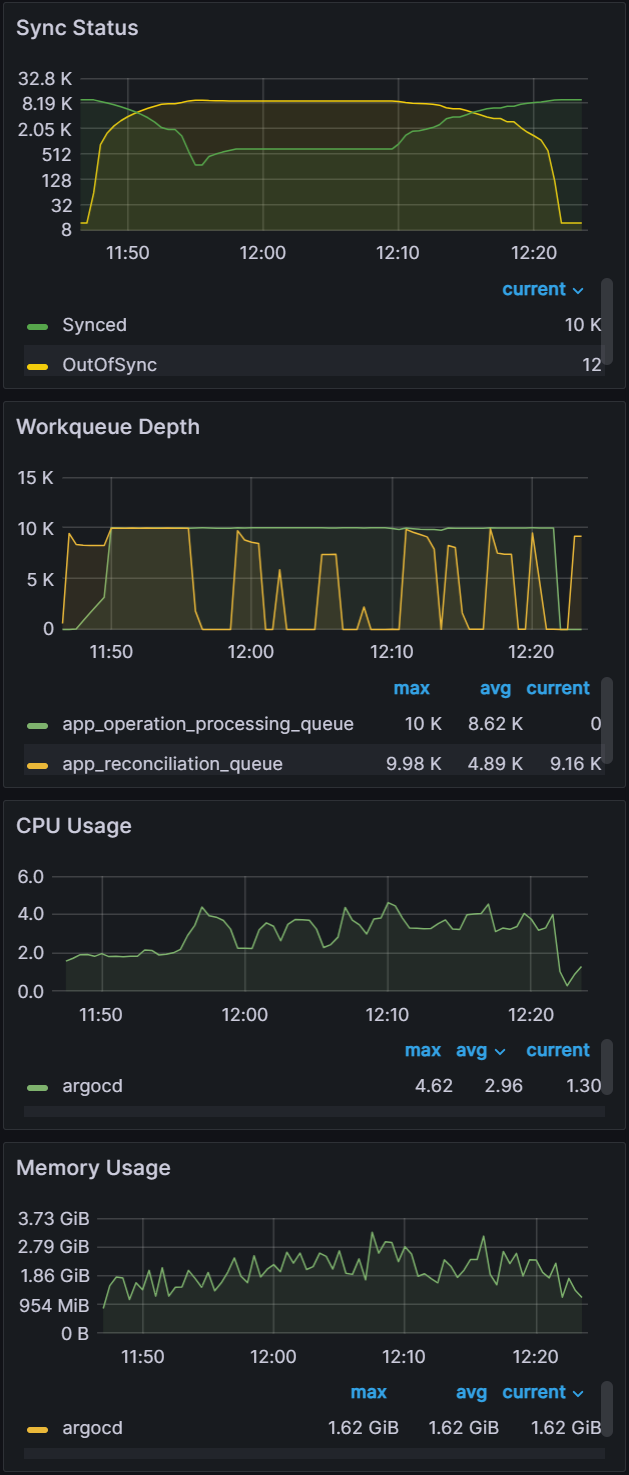
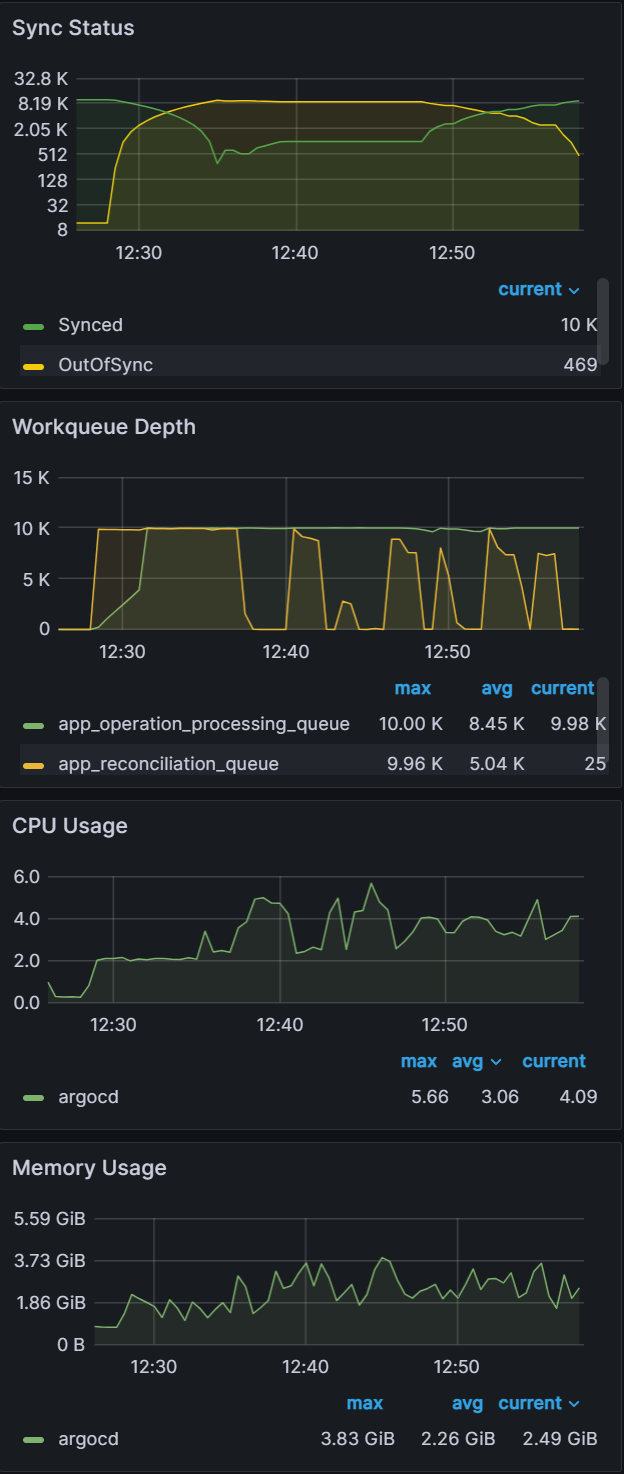
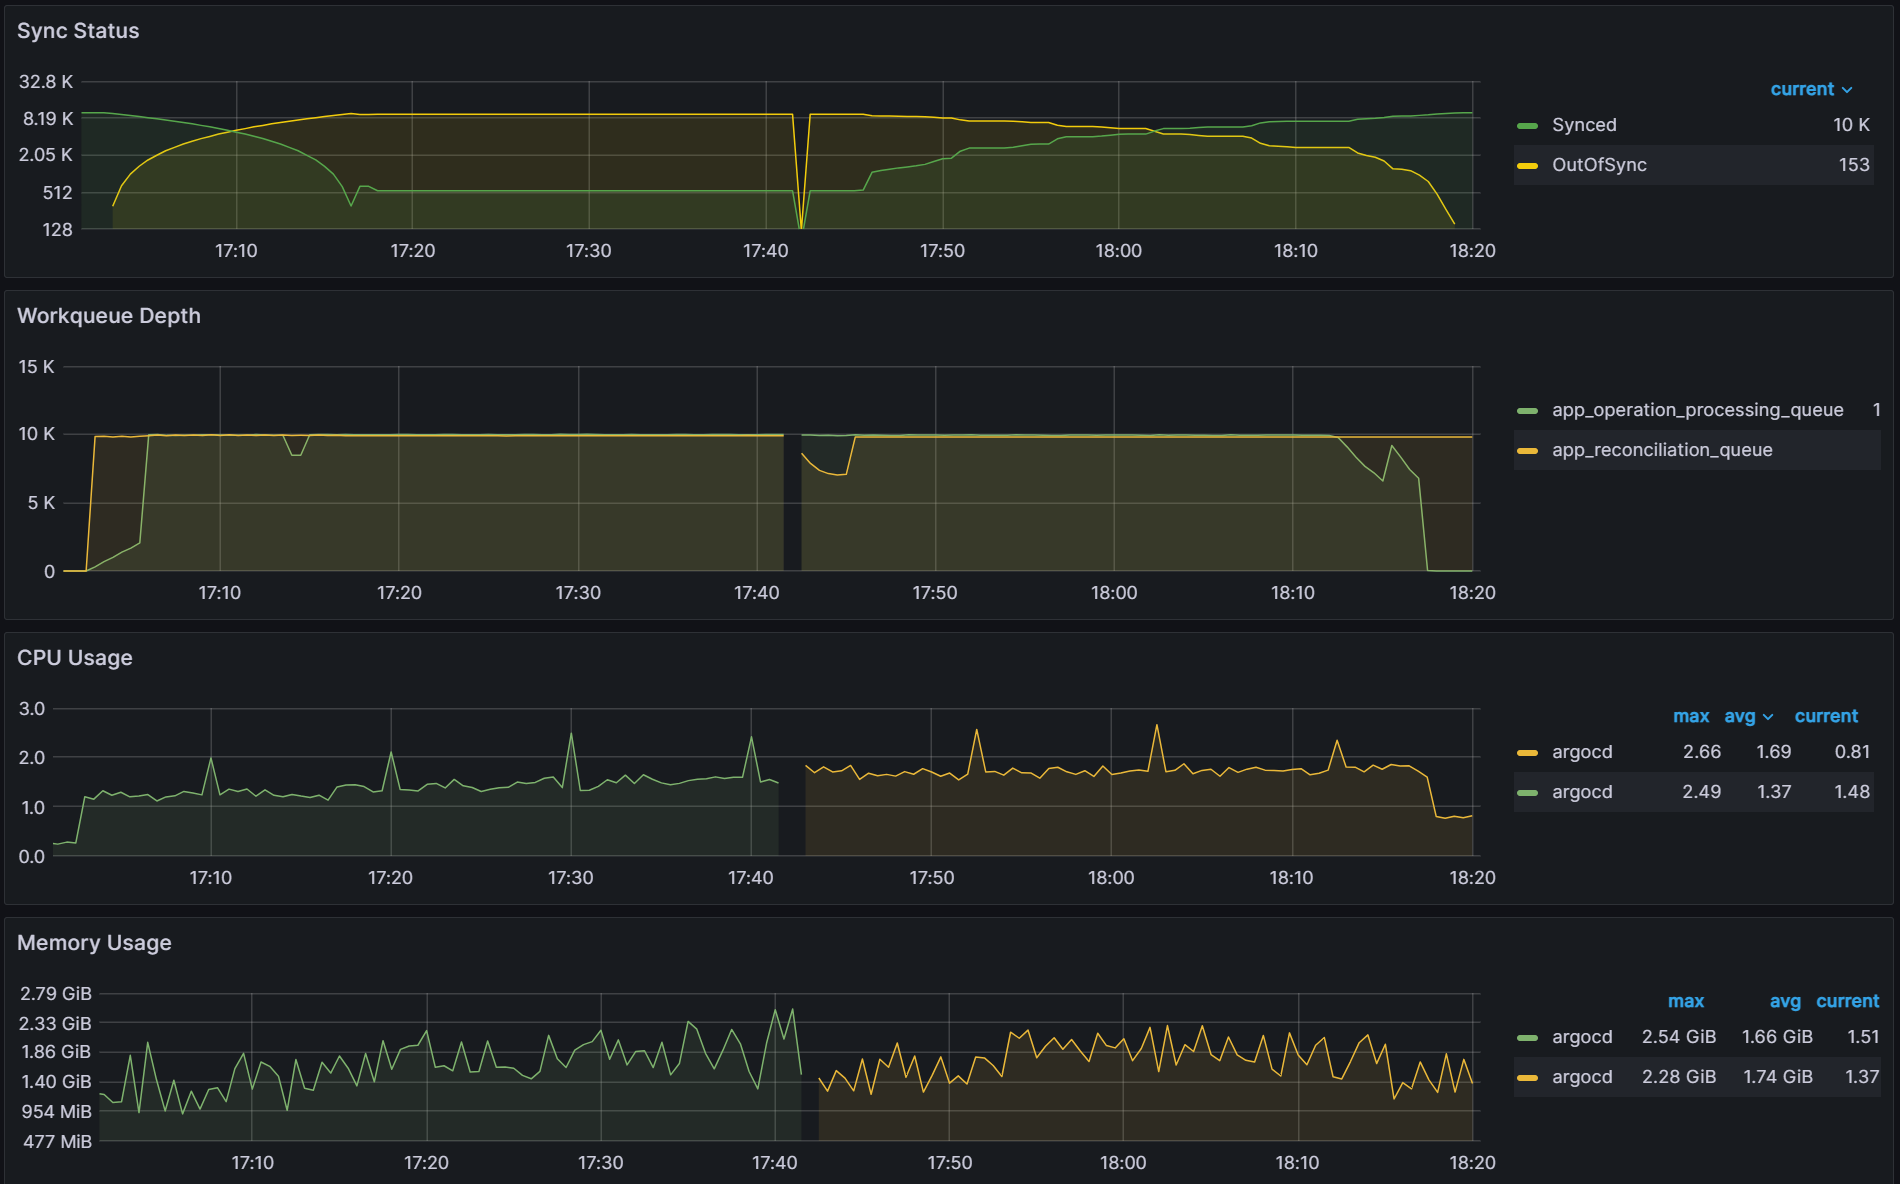
Observation 1 - Syncing never finishes and require a restart of the application controller to continue syncing

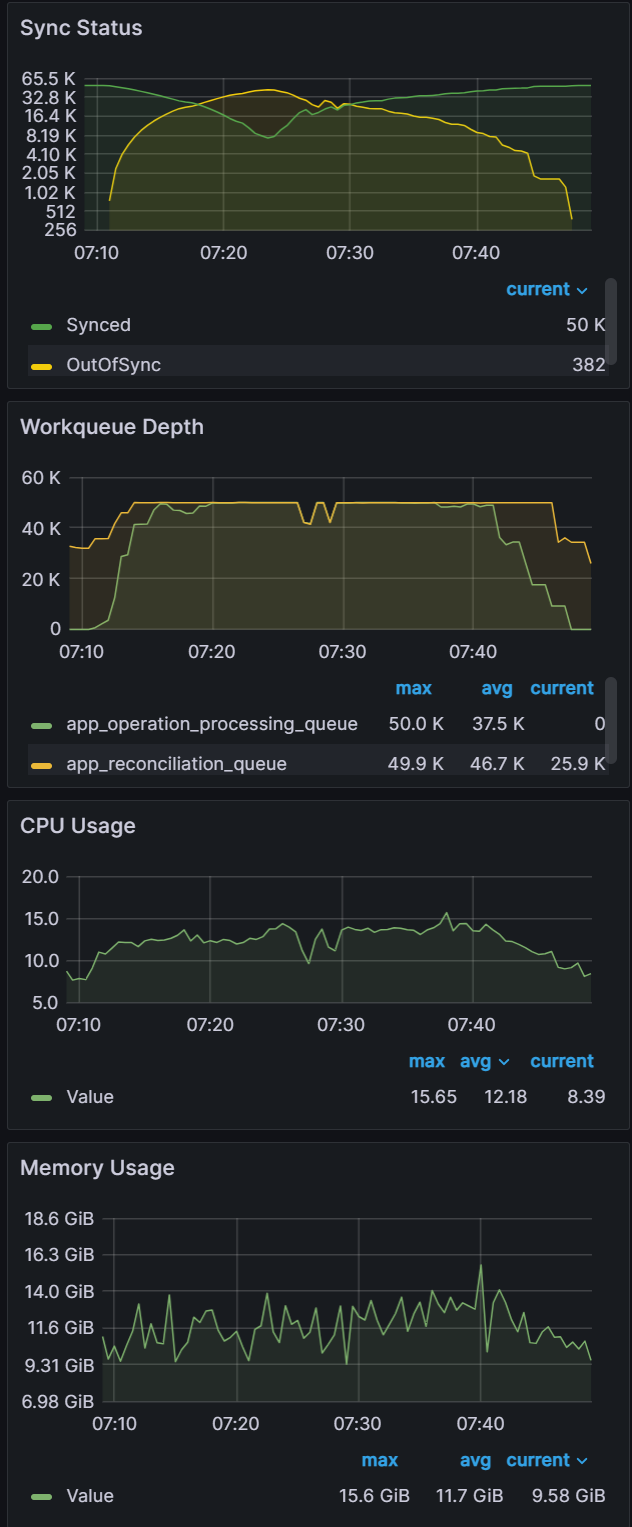
The screenshot below shows that from the start of the sync test at 17:02 till around 17:41, the sync process was deadlocked. We observed no changes to synced apps and the app_operation_processing_queue was pinned at 10k operations.
alt_text

Looking at the Argo CD console for a single application we see that the PreSync job finished 17 mins ago, but the application stayed in the Syncing phase.

alt_text

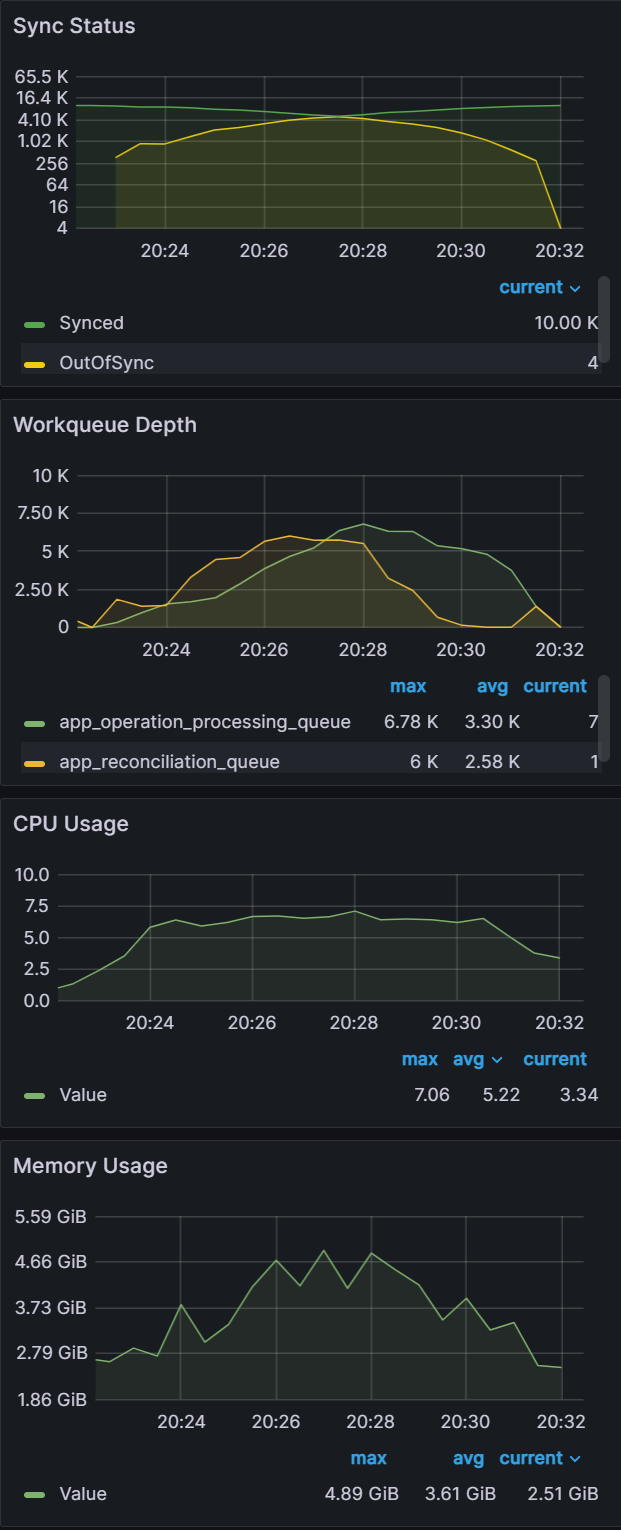
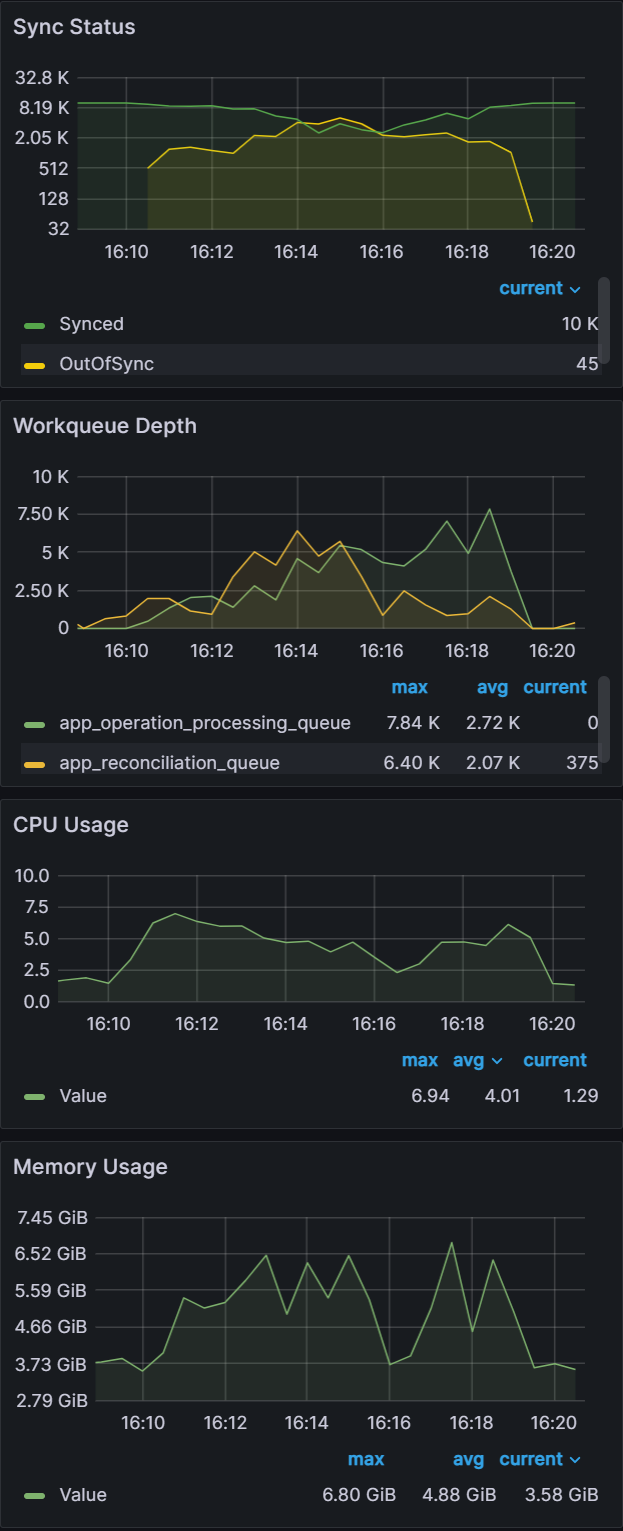
Observation 2: There is a link between client QPS/burst QPS and operation/status processor settings

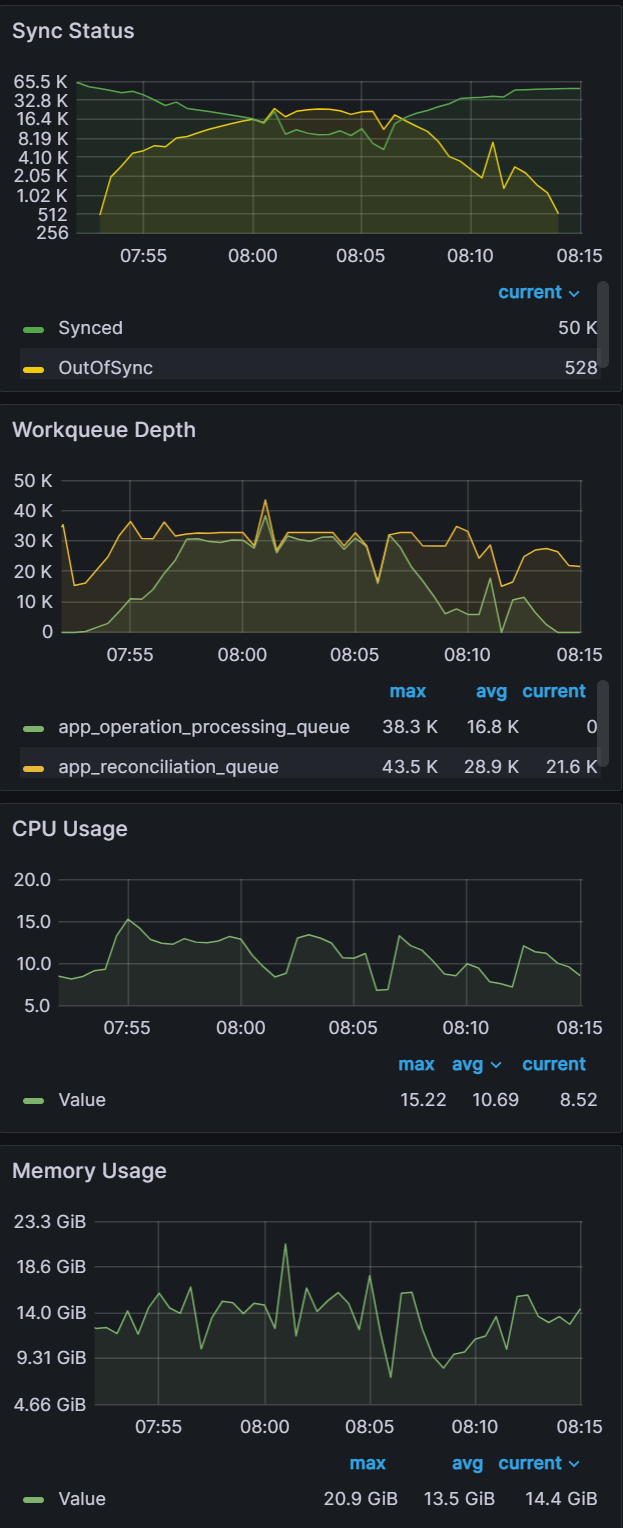
In order to fix the sync freezing issue, we increased the client QPS/burst QPS from the default 50/100 to 100/200. After the change we were able to collect data on operation/status processor settings.

operation/status processors: 25/50
Sync time: 45 mins
operation/status processors: 50/100
Sync time: 30 mins
alt_textalt_text

We can see that there is a link between status/operation processors and client QPS/burst QPS settings. Changing one or the other could be required to improve sync times and Argo CD performance depending on your environment. Our recommendation is to first change the status/operation processor settings. If you run into Argo CD locking up or the performance not increasing further, and you have sufficient resources, you can try increasing the client QPS/burst QPS. But as mentioned in the first experiment, ensure you are monitoring the k8s api-server.

Experiment 3: Cluster Scaling

Objective:

The following experiment is designed to test the compute demands of the Argo CD app controller managing clusters with more than 100 applications.

Test Infrastructure:

Central Argo CD cluster with 10 app controller shards running on a single m5.2xlarge node managing 100/250/500 application clusters and 10k 2KB ConfigMap applications.

Observations:

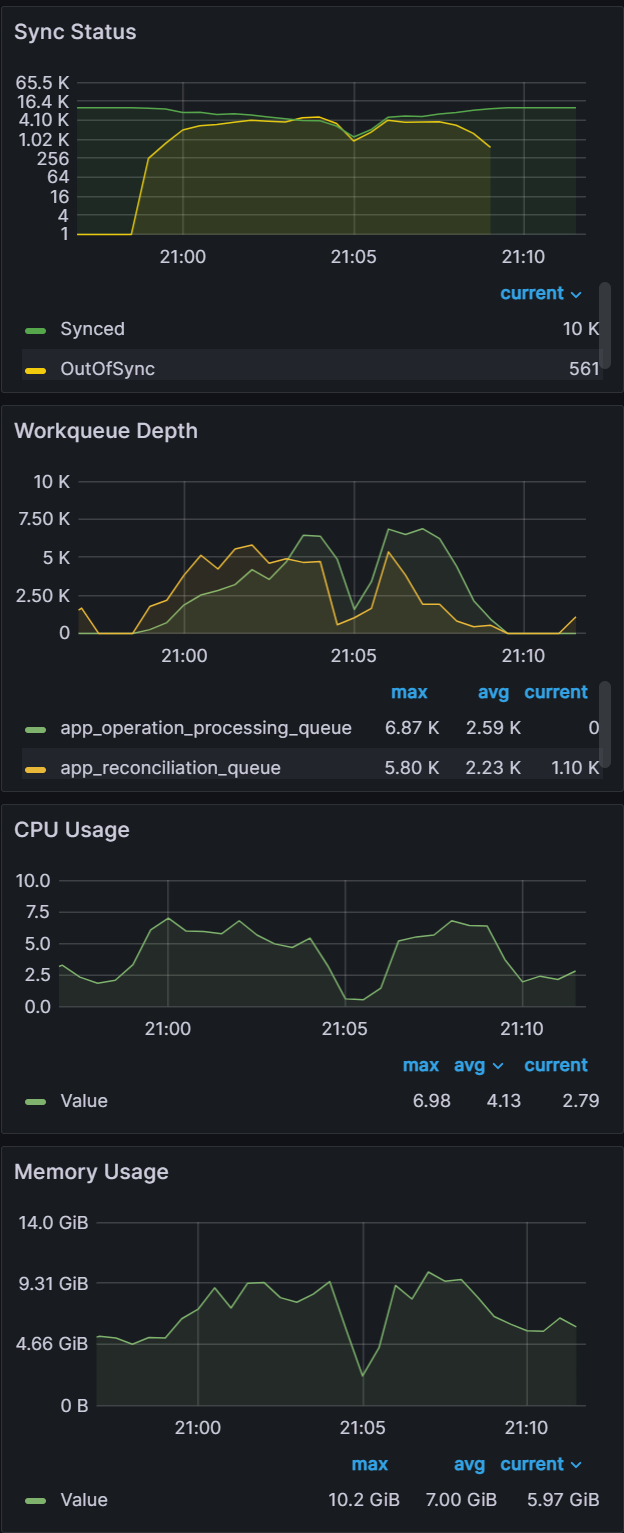
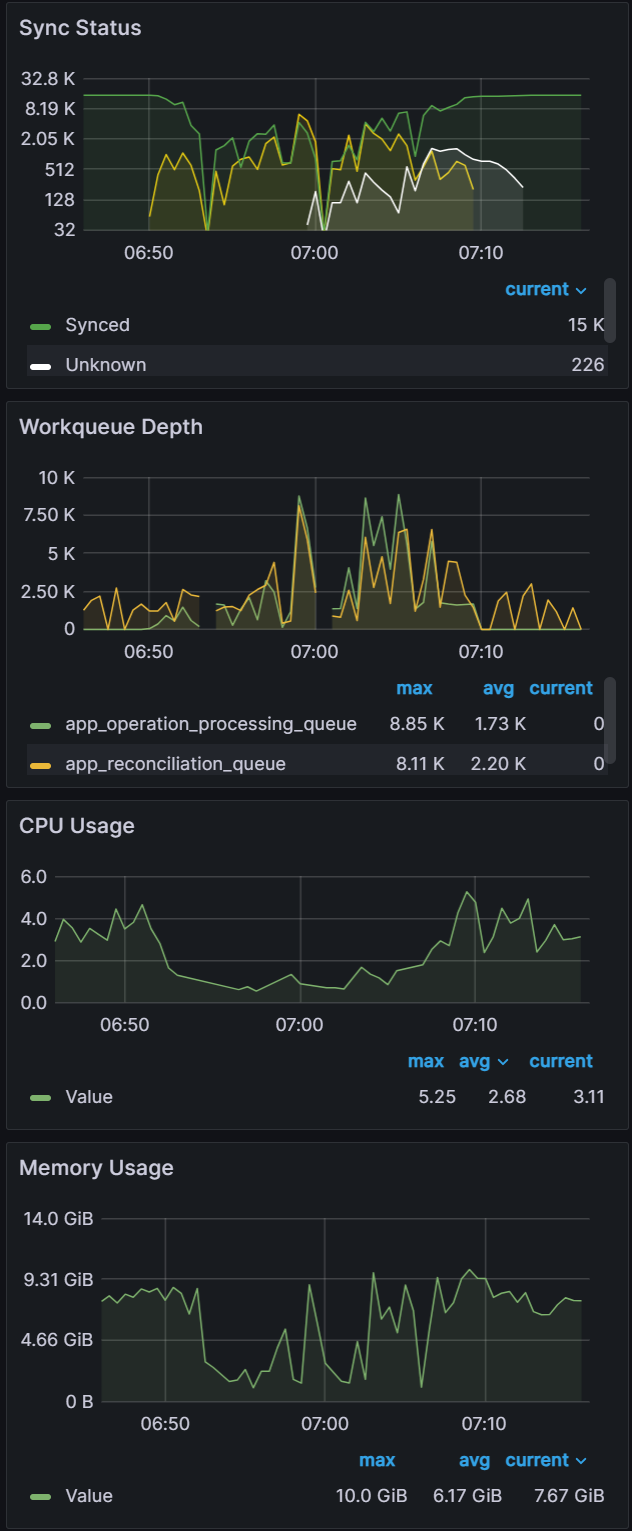
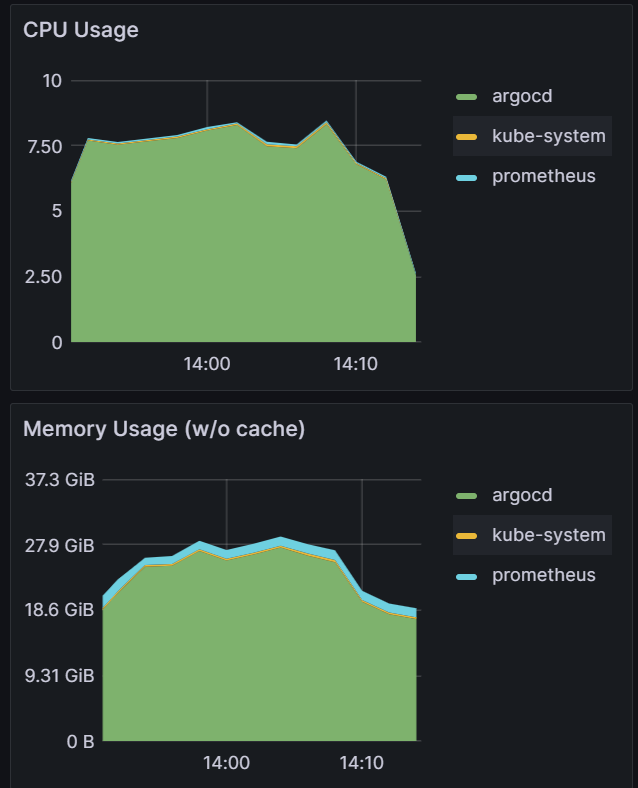
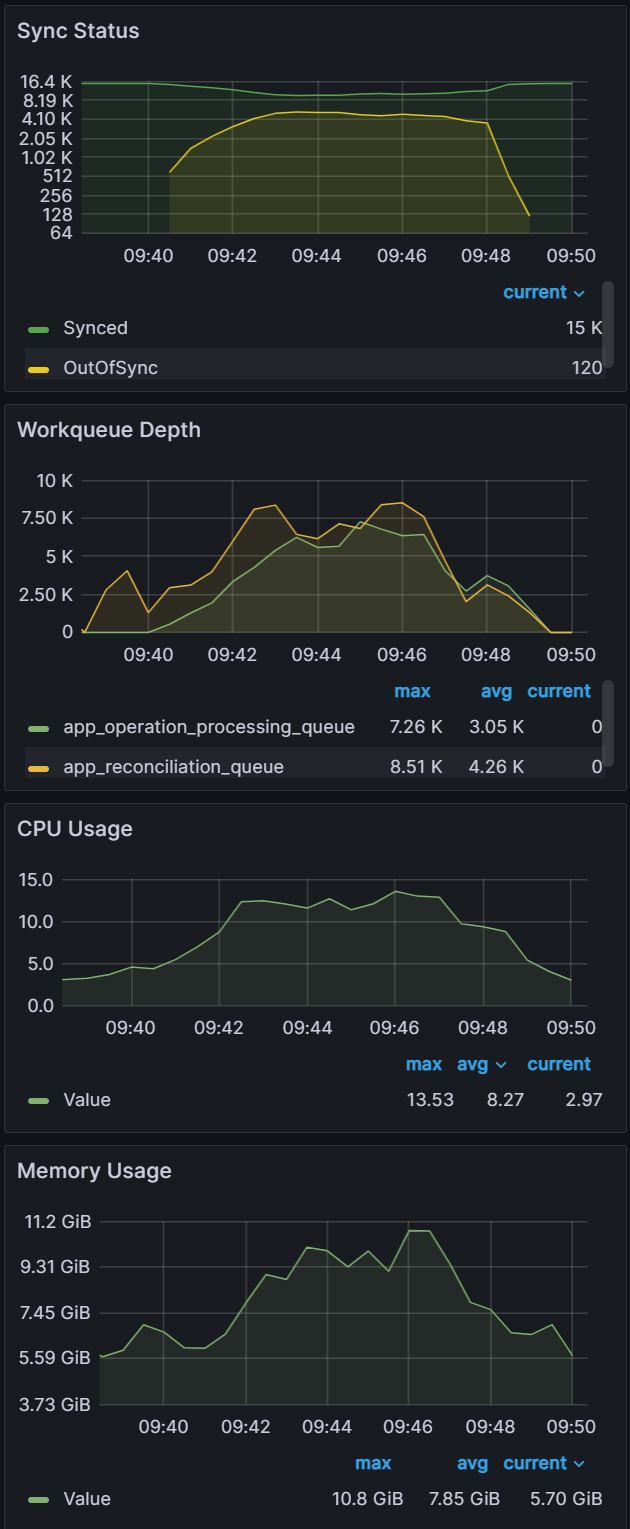
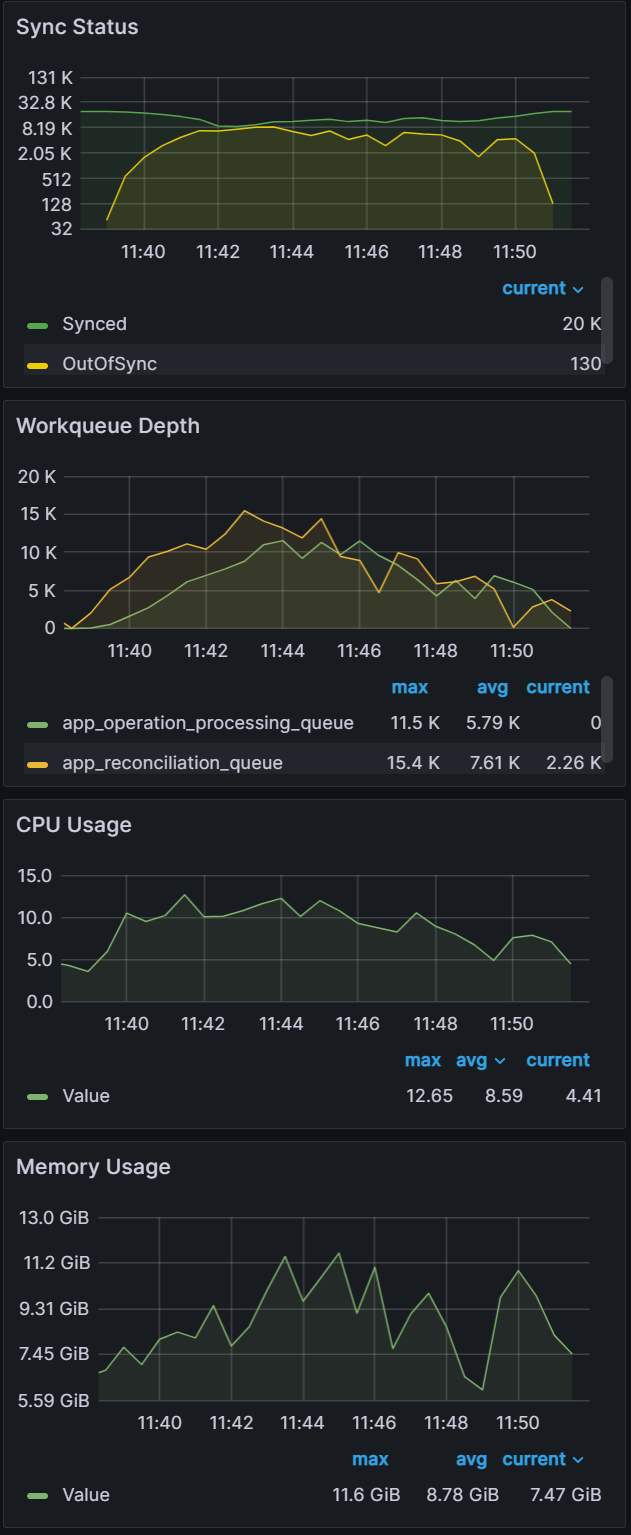
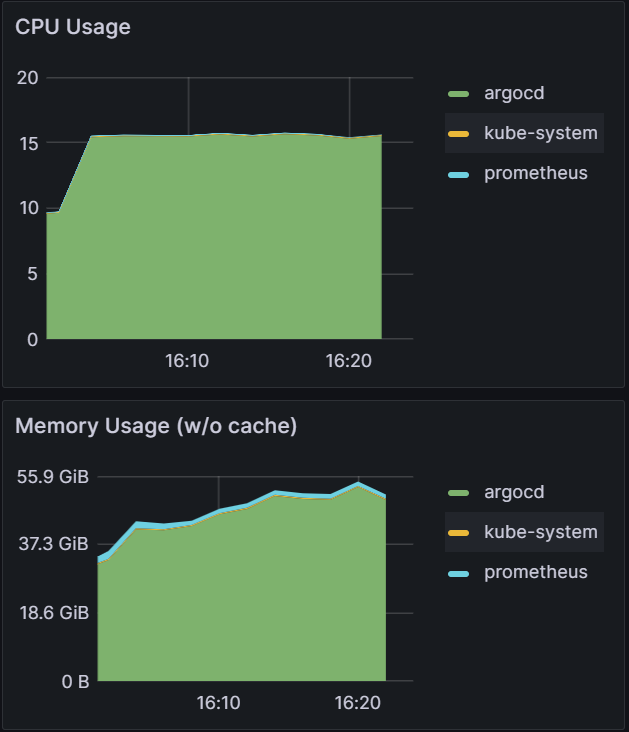
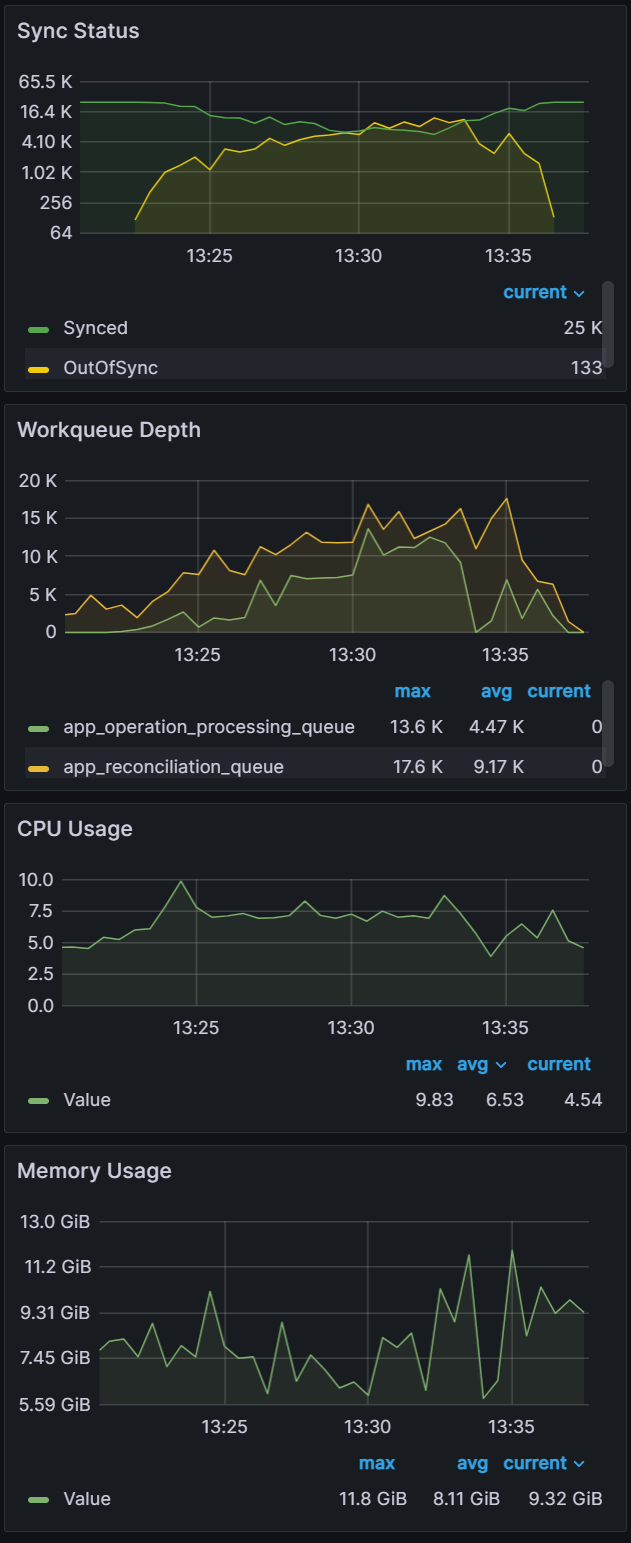
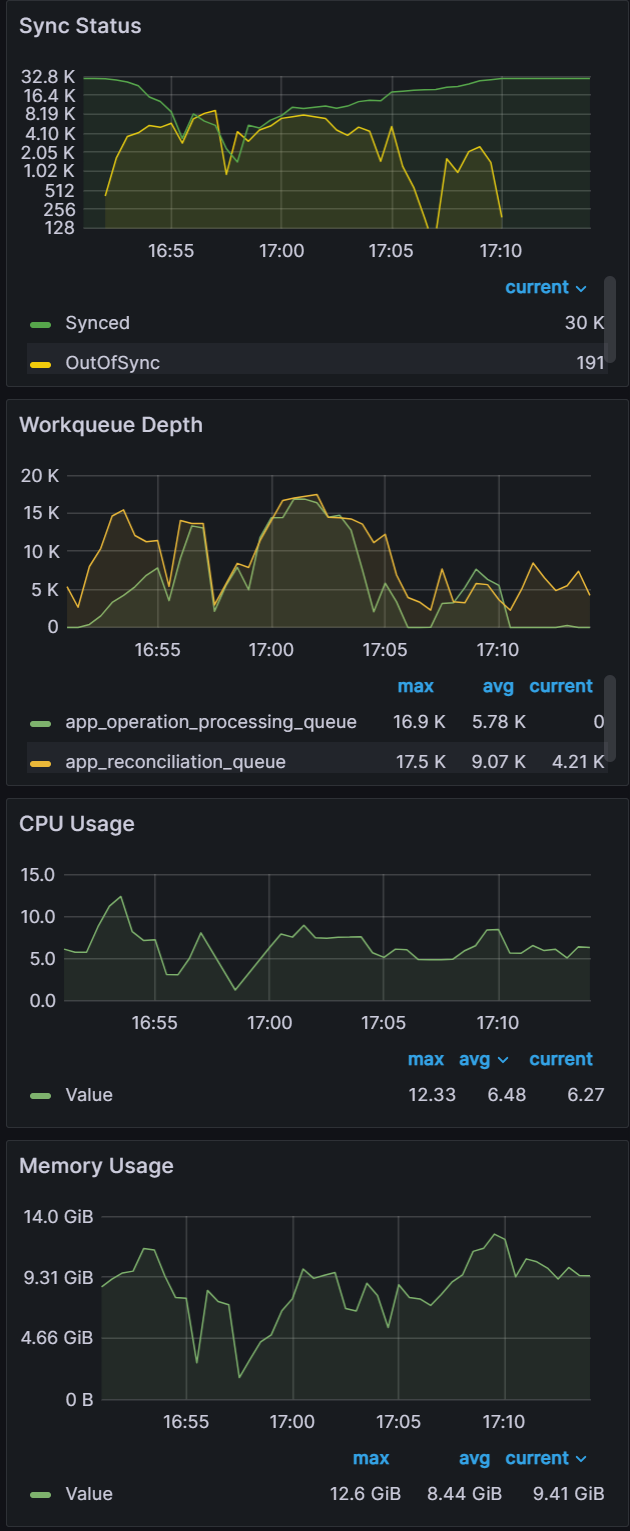
From earlier experiences, we can see that when managing 100 clusters, we are close to the limit of a single m5.2xlarge node. As we push further and to 250/500 clusters, we have two observations. The first observation is that the graph data is less smooth than the sync test of 100 clusters. This can indicate that Prometheus is running out of compute as Argo CD is consuming most of it. Please note that we are not using any resource limits/requests in our experiments. If proper resource limits/requests are set, most likely we would only see performance issues with Argo CD and not Prometheus, when operating at the limit of your compute resources. The second observation is that on both the 250/500 cluster tests, there are some drop off in metric data. For the 250 cluster test, there is a blip at the 16:16 mark for Memory Usage. For the 500 cluster test there are blips in data at the 21.05 mark on the Workqueue depth, CPU usage, and Memory usage. In spite of these observations, the sync process completes in a reasonable time.

Clusters: 100
Sync time: 9 mins
Clusters: 250
Sync time: 9 mins
Clusters: 500
Sync time: 11 mins
alt_textalt_textalt_text
From this experiment, you can see that as you approach the limit of your compute resources, Argo CD and other applications running in your k8s environment could experience issues. It is recommended that you set proper resource limits/requests for your monitoring stack to ensure you have insights into what could be causing your performance issues.

Experiment 4: Application Scaling

Objective:

This experiment is meant to push the Argo CD app controller beyond 10k applications. As the previous rounds of experiments were performed with 10k apps, the intention of these experiments is to scale the Argo CD app controller up to 50k apps.

Test Infrastructure:

We will be performing this experiment on a Central Argo CD cluster with 10 app controller shards and 500 downstream application clusters. As we scale up the applications up to 10k,15k,20k,25k,30k,50k 2KB ConfigMap applications, we will add additional m5.2xlarge node(s) to the Argo CD cluster.

Observations:

Sync test at 15k applications with a single m5.2xlarge. You can see blips in data indicating unhealthy behavior on the cluster.CPU and Memory Usage is near 100% utilization of 8 vCPUs and 30 GB of memory.After adding another node for a total of two m5.2xlarge, we were able to perform a sync in 9 mins.
alt_textalt_textalt_text

After adding another node, we were able to continue our application scaling tests. You can see in the graphs below that syncing 20k and 25k apps was not a problem. The sync test of 30k apps shown on the third graph shows some blips in data, indicating that we are at the limits of two nodes.

Apps: 20000
Sync time: 12 mins
Apps: 25000
Sync time: 11 mins
Apps: 30000
Sync time: 19 mins
alt_textalt_textalt_text

For the final test in this experiment, we pushed the cluster to sync 50k apps.

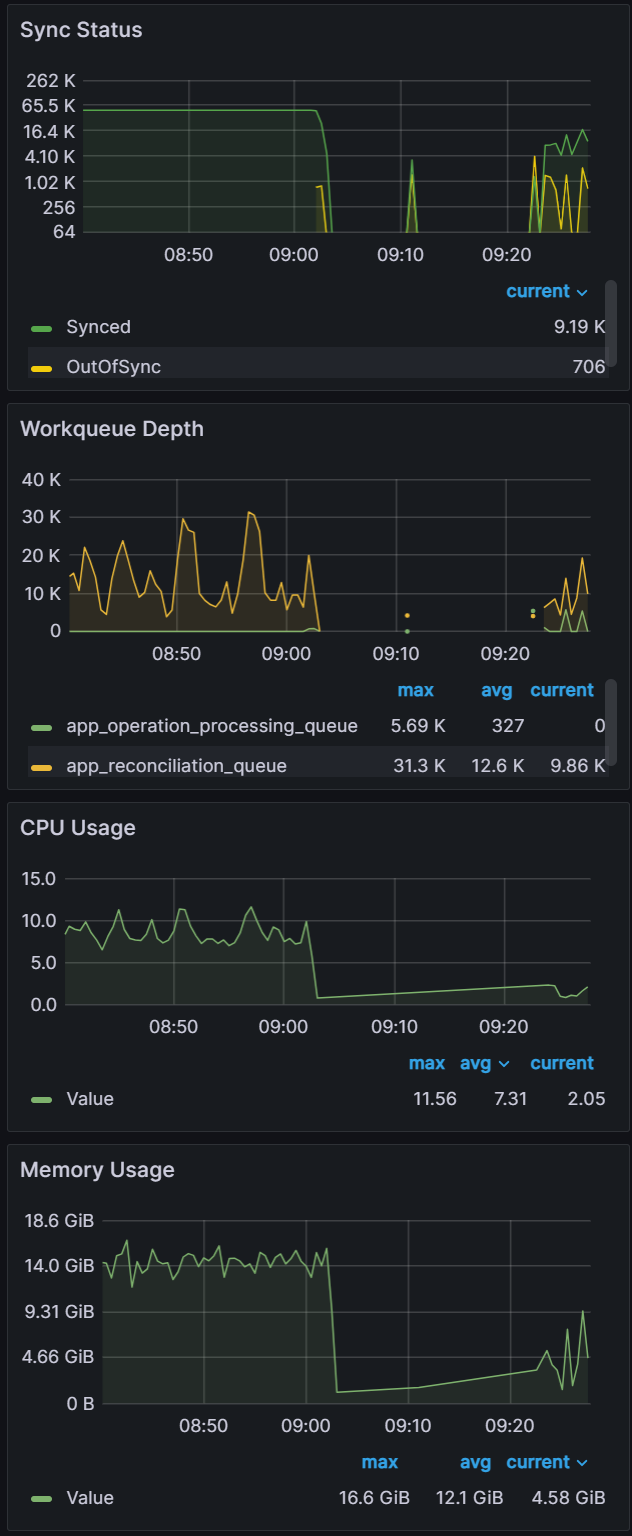
While the cluster was able to manage reconciliation for the 50k apps as shown by a stable Sync Status graph from 8:40, when we start the sync at the 9:02 mark, you can see unhealthy behavior in the graph data.From examining the CPU/Memory Usage, you can see we have 100% CPU utilization across the cluster.After scaling the cluster to three m5.2xlarge nodes, we were able to perform a sync in 22 mins.
alt_textalt_textalt_text

From the scaling tests, we can see that the Argo CD app controller scales effectively by adding compute resources as we increase the number of applications to sync.

Experiment 5: How Many Shards?

Objective:

In previous experiments, we utilized ten app controller shards running across multiple nodes. In this experiment, we will explore how the number of app controller shards affect performance.

Test Infrastructure:

Central Argo CD cluster with 3, 6, 9 app controller shards running on 3 m5.2xlarge node(s) managing 500 application clusters and 50k 2KB ConfigMap applications.

Observations:

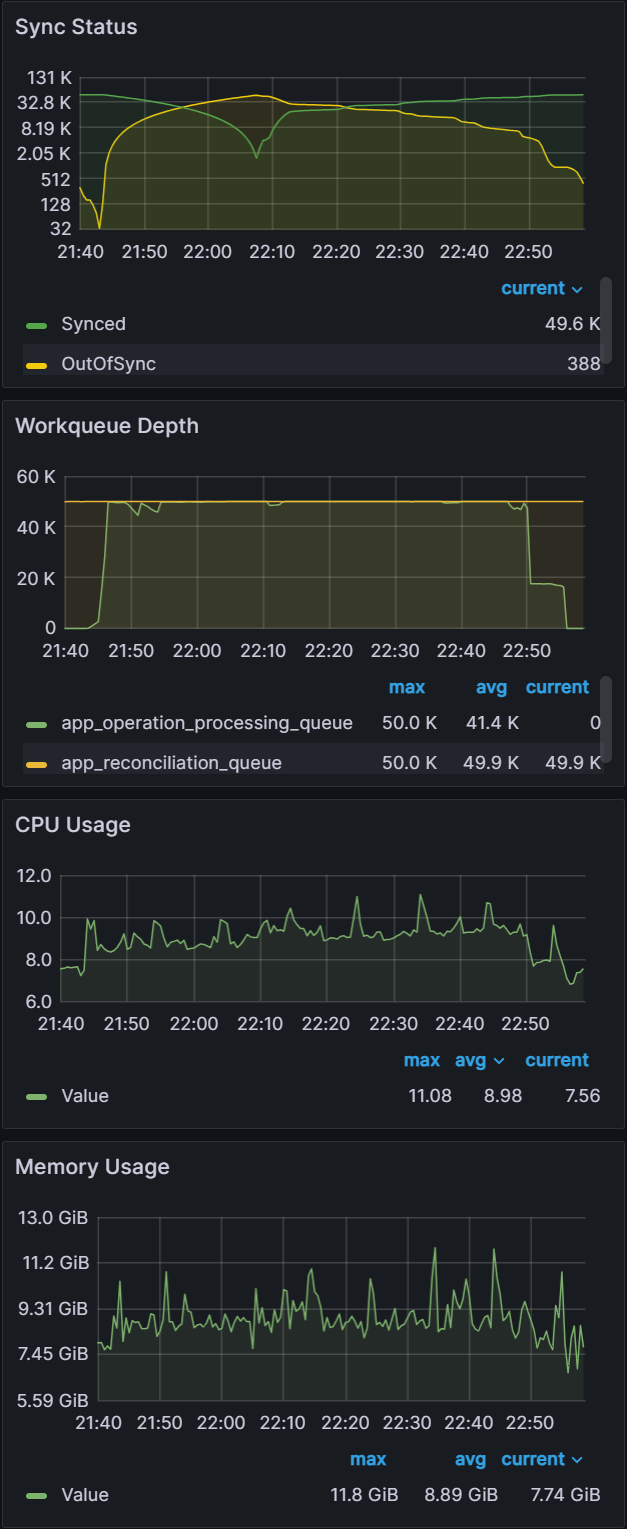
For the baseline of three shards it took 75 mins to perform a sync. Adding additional shards saw further improvements with a sync time of 37 mins for six shards and a sync time of 21 mins for nine shards. Further increasing shards beyond nine did not yield any improvements.

Shards: 3
Sync time: 75 mins
Shards: 6
Sync time: 37 mins
Shards: 9
Sync time: 21 mins
alt_textalt_textalt_text

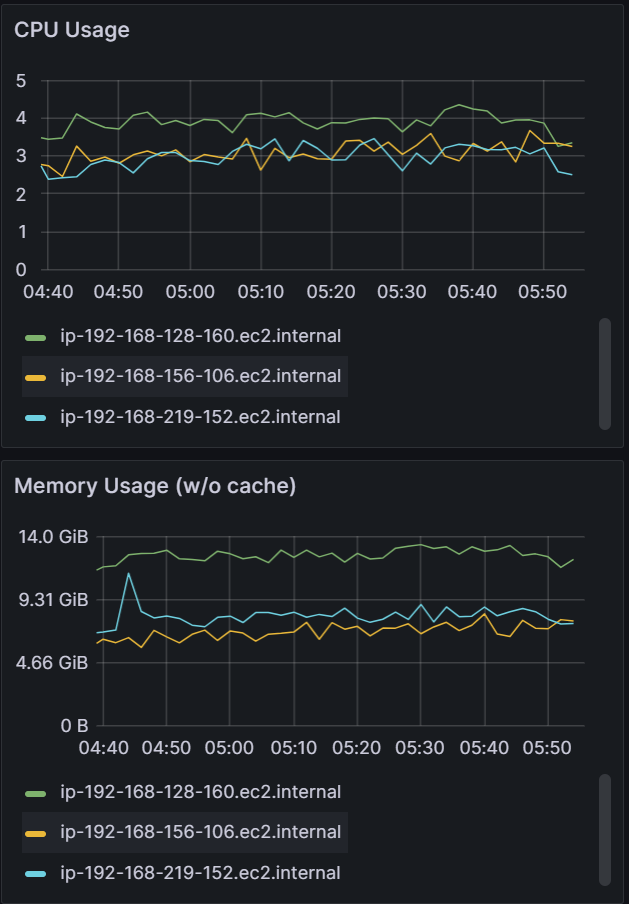
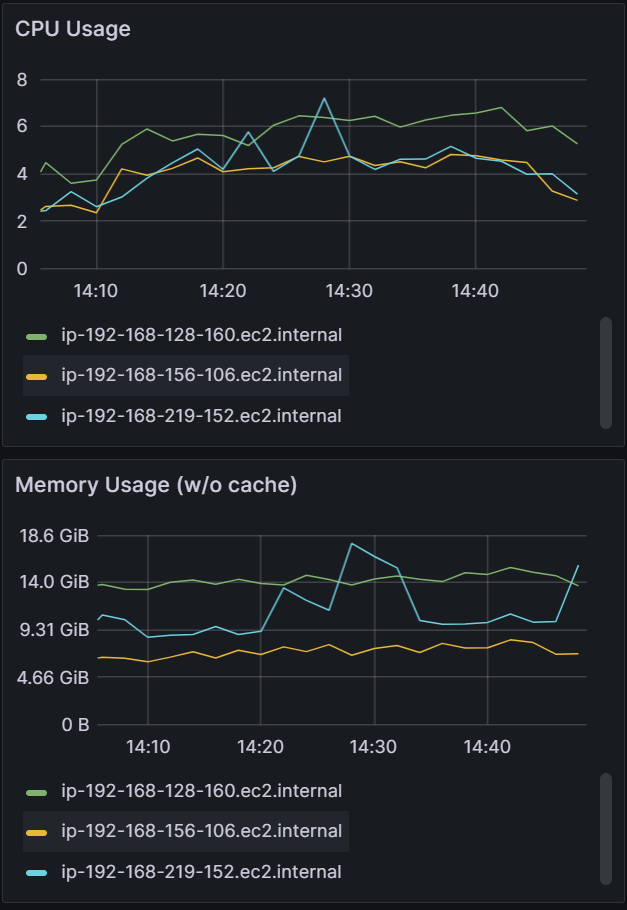
Looking at the CPU and Memory utilization, you can see that adding shards can improve performance only if there are free resources to consume. With the baseline of three shards, CPU utilization of the nodes are well below eight vCPU that each node is allocated. As we add more shards, we can see CPU utilization increasing until we are close to 100% CPU Utilization with nine shards. Adding any more shards would not yield any performance benefits unless we add more nodes.

Shards: 3Shards: 6Shards: 9
alt_textalt_textalt_text

From the experiments, the Argo CD app controller sharding mechanism is able to scale as you add more compute resources. Sharding allows both horizontal and vertical scaling. As you add more shards, you can horizontally scale by adding more nodes or vertically scale by utilizing a larger node with more compute resources.

Experiment 6: Sharding Deep Dive

Objective:

With the release of Argo CD 2.8, a new sharding algorithm: round-robin was released. The existing legacy sharding algorithm performed a modulo of the number of replicas and the hash sum of the cluster id to determine the shard that should manage the cluster. This led to an imbalance in the number of clusters being managed by each shard. The new round-robin sharding algorithm is supposed to ensure an equal distribution of clusters being managed by each shard. We will also introduce 3 new algorithms: greedy minimum, weighted ring hash, and consistent hash with bounded loads. This experiment will evaluate all the algorithms on shard balance, application distribution and rebalancing on changes to the environment.

Test Infrastructure:

Central Argo CD cluster with 10 app controller shards running on 1 m5.2xlarge node managing 100 application clusters and 10k 2KB ConfigMap applications.

Observations:

Note: For all the observations, we start monitoring-period when we see items in the operations queue. We end the monitoring-period when all the applications are synced. We then look at the avg metric of CPU/Memory usage during the monitoring-period.

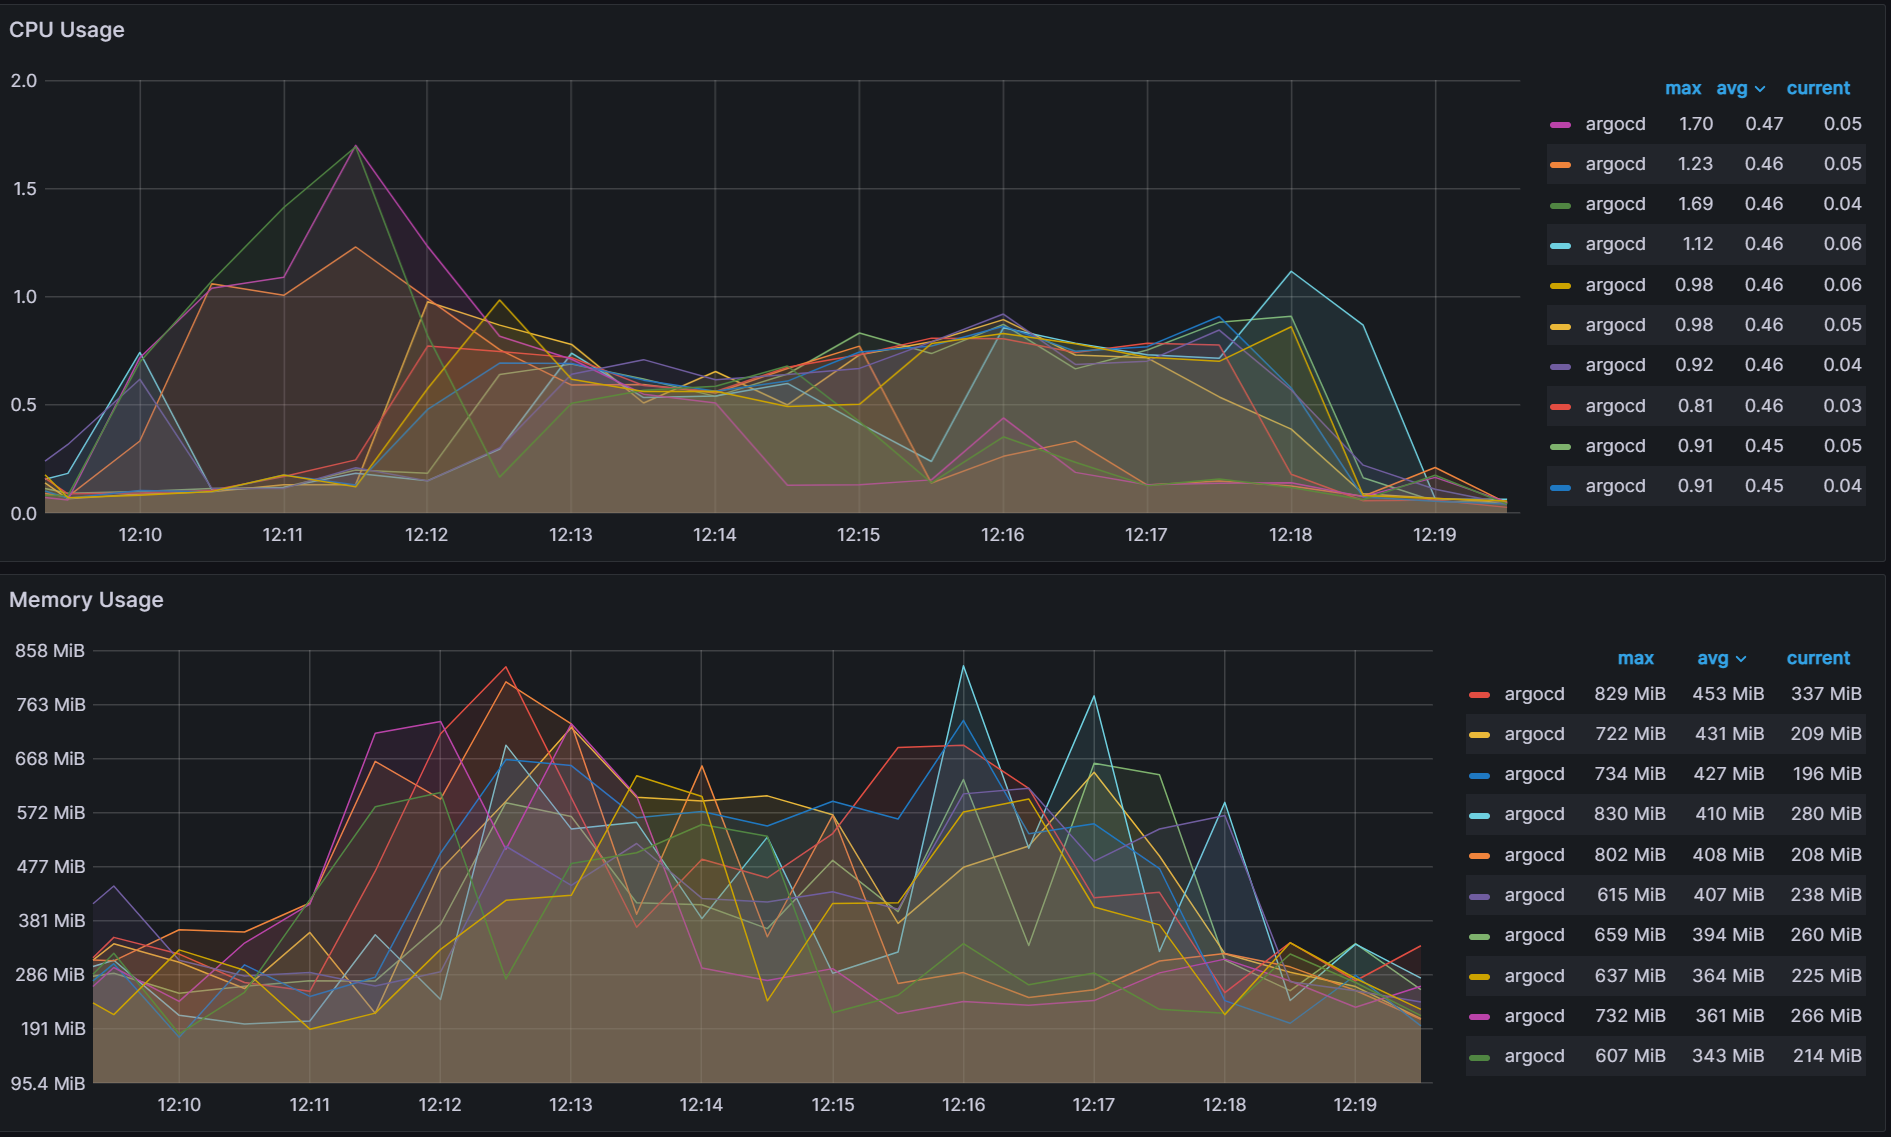
Legacy

The graph below shows the CPU Usage/Memory Usage of the 10 different Argo CD App Controller shards. Looking at the avg, you can see a large variation to how much each shard is utilizing its resources. To make an accurate comparison between the different sharding methods, we calculate the variability by determining the range of the data for both avg CPU usage and Memory usage. The CPU usage variability is calculated by taking the shard with the highest CPU usage and subtracting it from the shard with the least CPU usage: 0.55 - 0.23 = 0.32. The Memory usage variability is 452 MiB - 225 MiB = 227 MiB.

Variability:
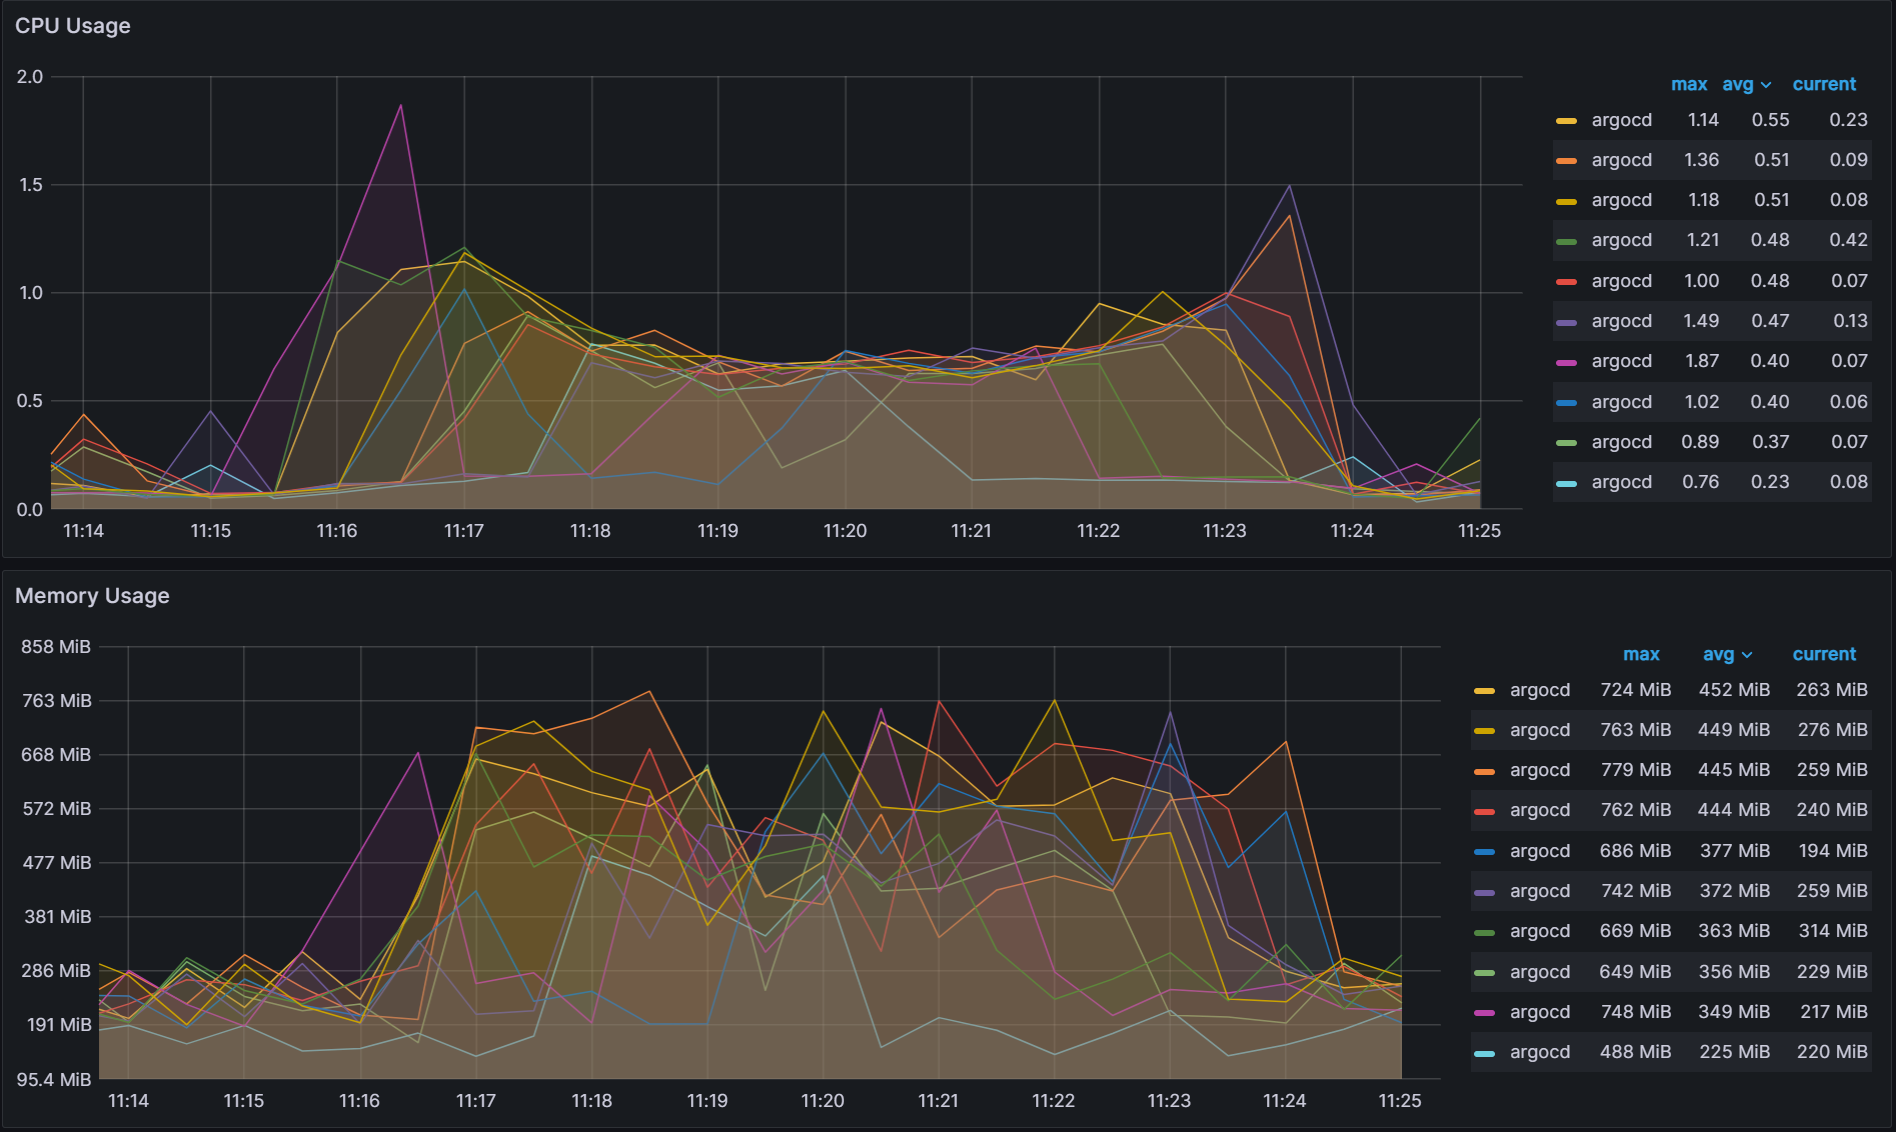
CPU:0.32
Memory:227 MiB

alt_text

Round-Robin

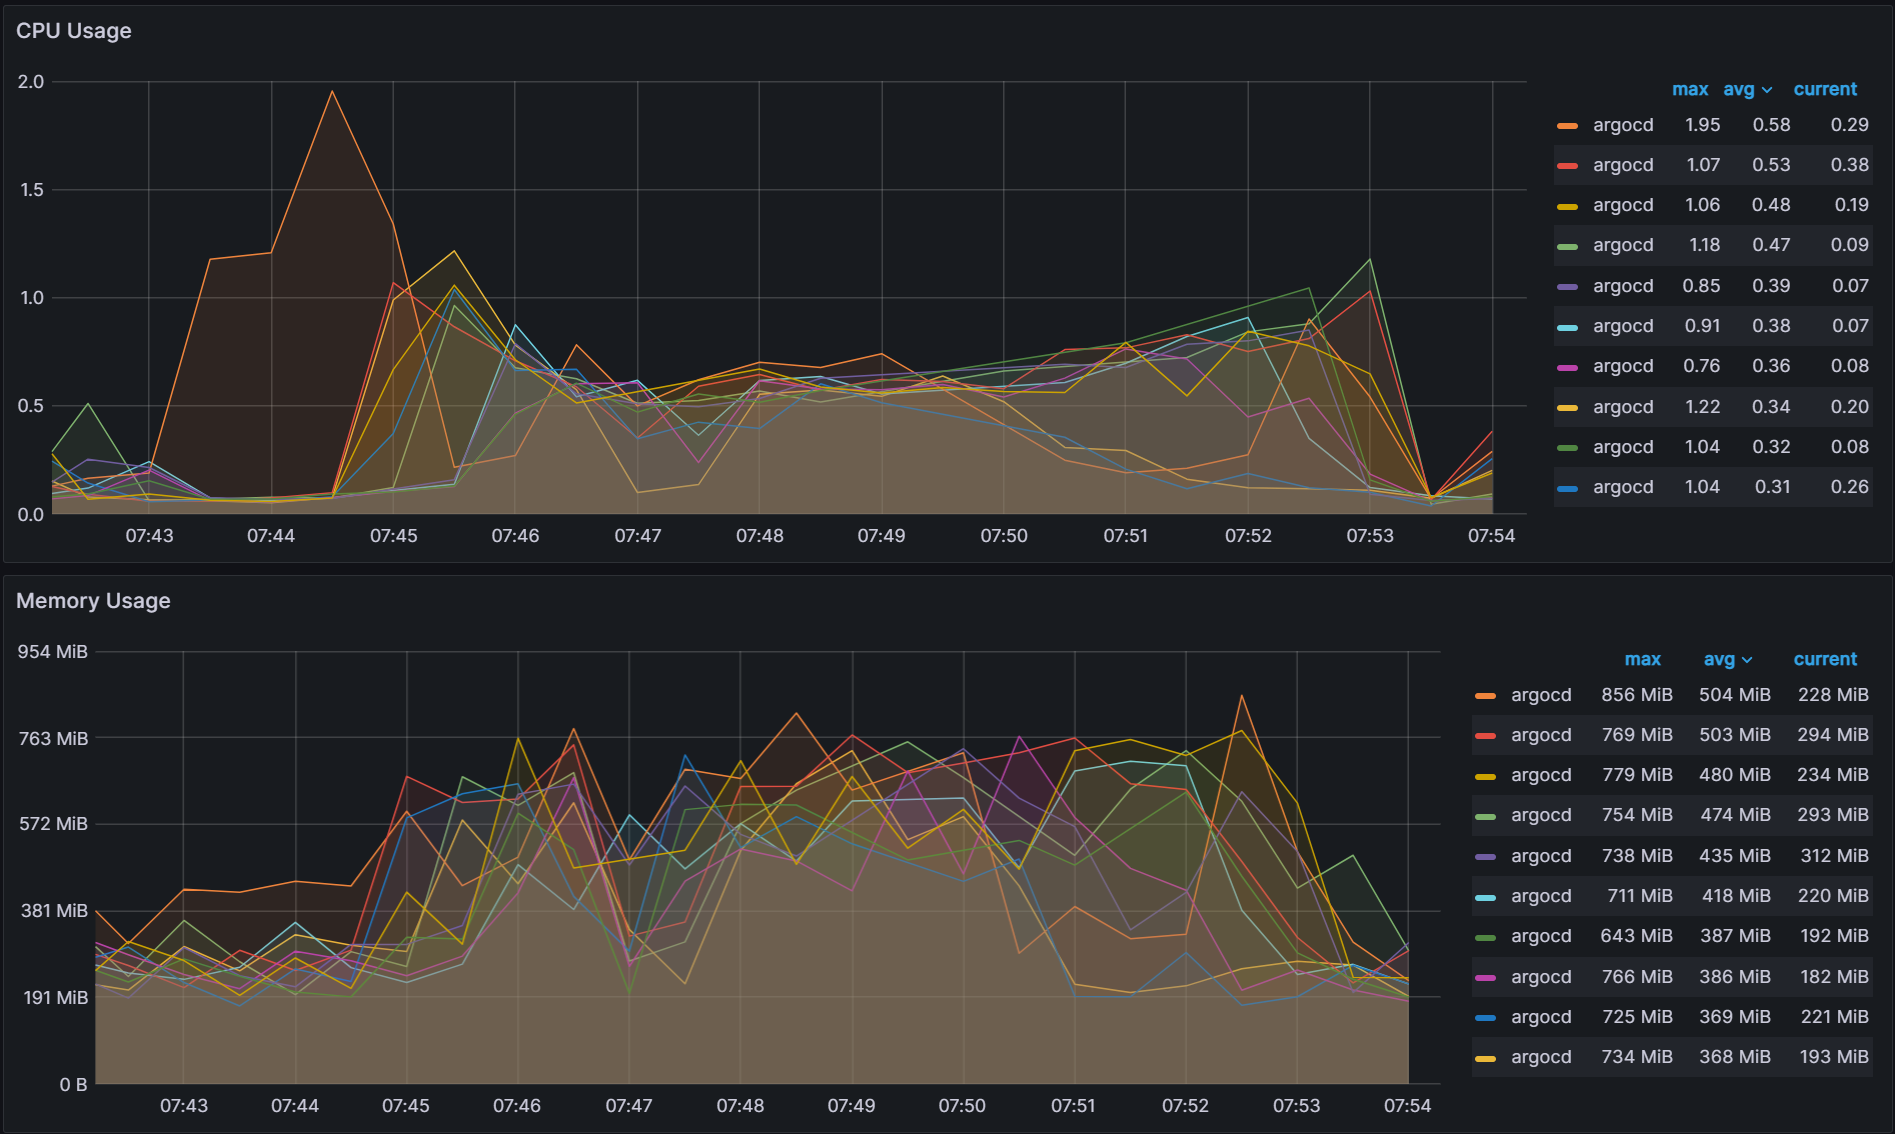
With the newly introduced Round-Robin algorithm, you can see improved balance across the shards.

Variability:
CPU:0.02
Memory:110 MiB

alt_text

Better but not perfect

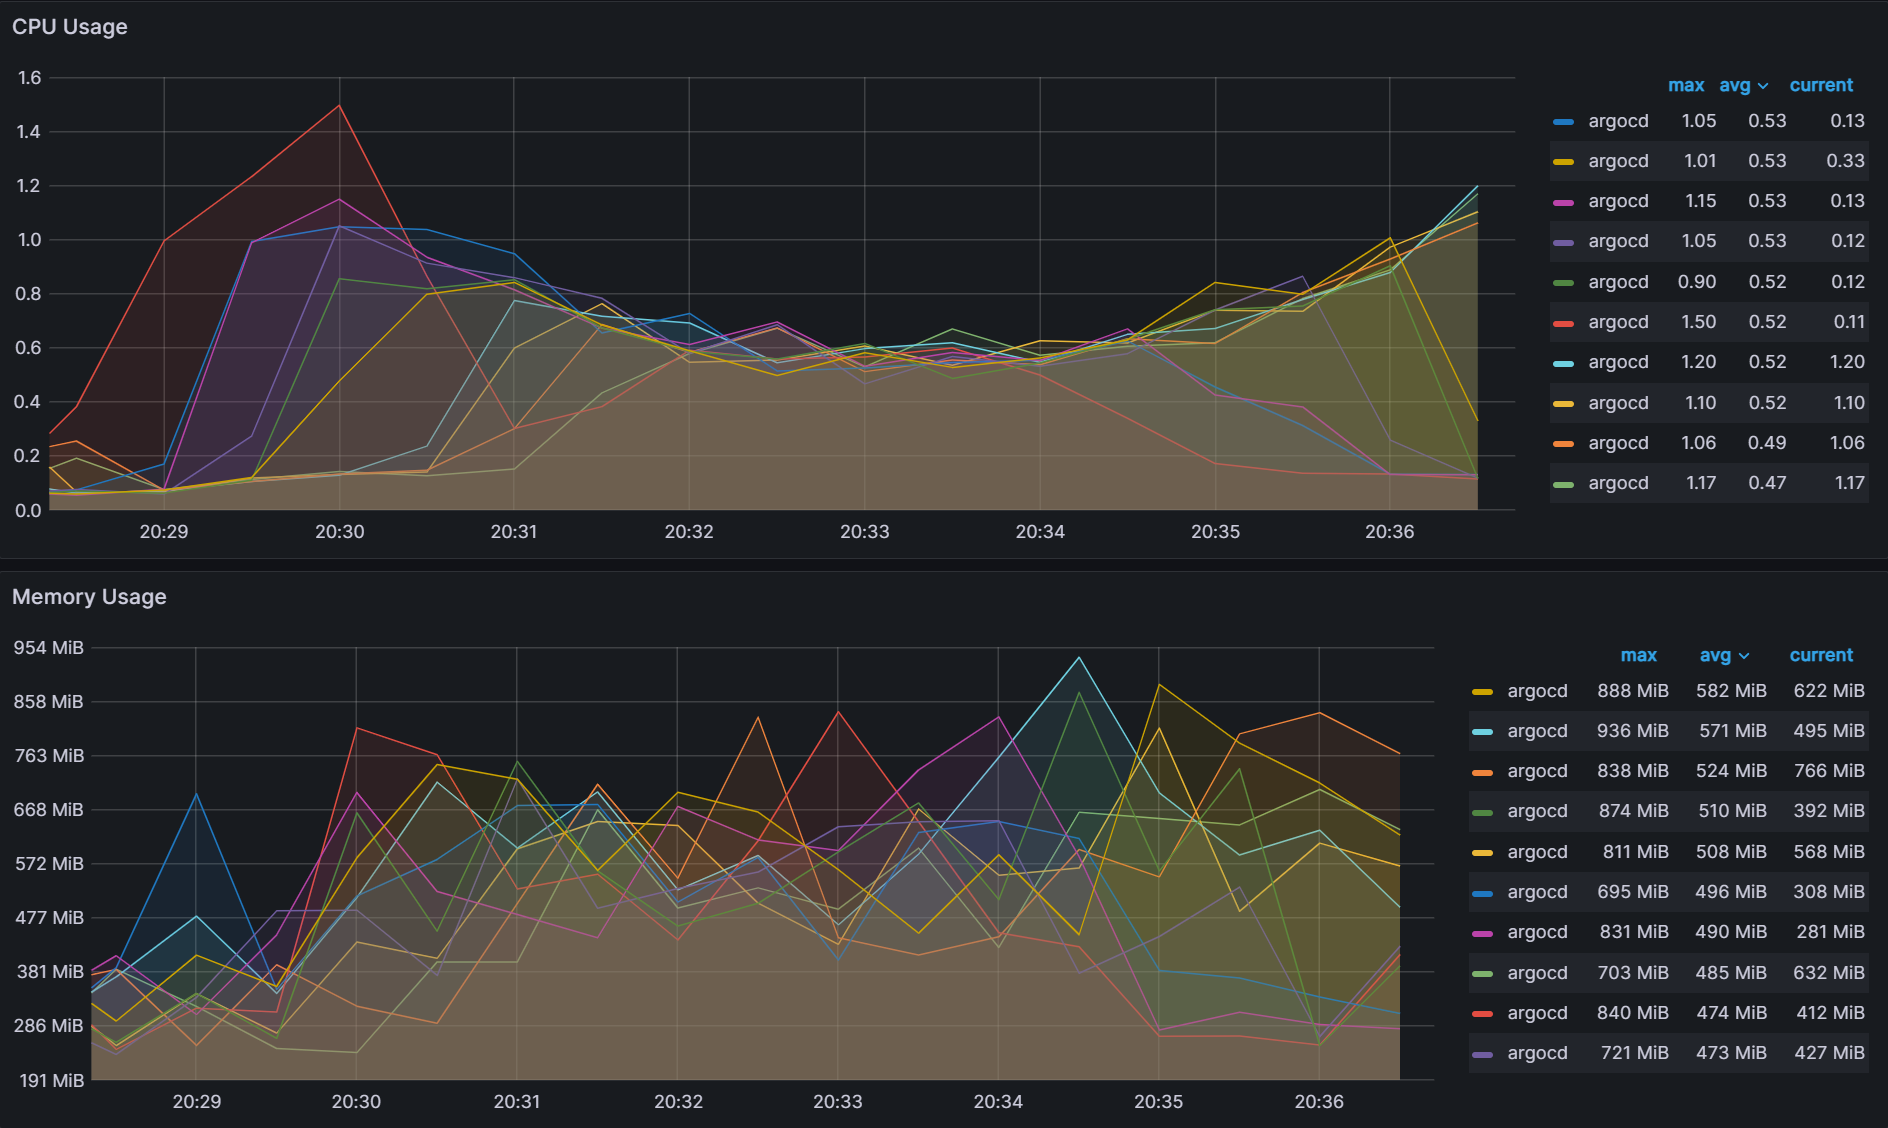
The new round-robin algorithm does a better job of keeping the number of clusters balanced across the shards. But in a real world environment, you would not have an equal number of applications running on each cluster and the work done by each shard is determined not by the number of clusters, but the number of applications. A new experiment was run which deploys a random number of applications to each cluster with the results below. Even with the round-robin algorithm, you can see some high variability in CPU/Memory usage.

Variability:
CPU:0.27
Memory:136 MiB

alt_text

Greedy Minimum Algorithm, sharding by the Number of Apps

A new algorithm is introduced in order to shard by the number of applications that are running on each cluster. It utilizes a greedy minimum algorithm to always choose the shard with the least number of apps when assigning shards. A description of the algorithm is shown below:

Iterate through the cluster list:

1. Determine the number of applications per cluster.
2. Find the shard with the least number of applications.
3. Add the number of applications to the assigned shard.

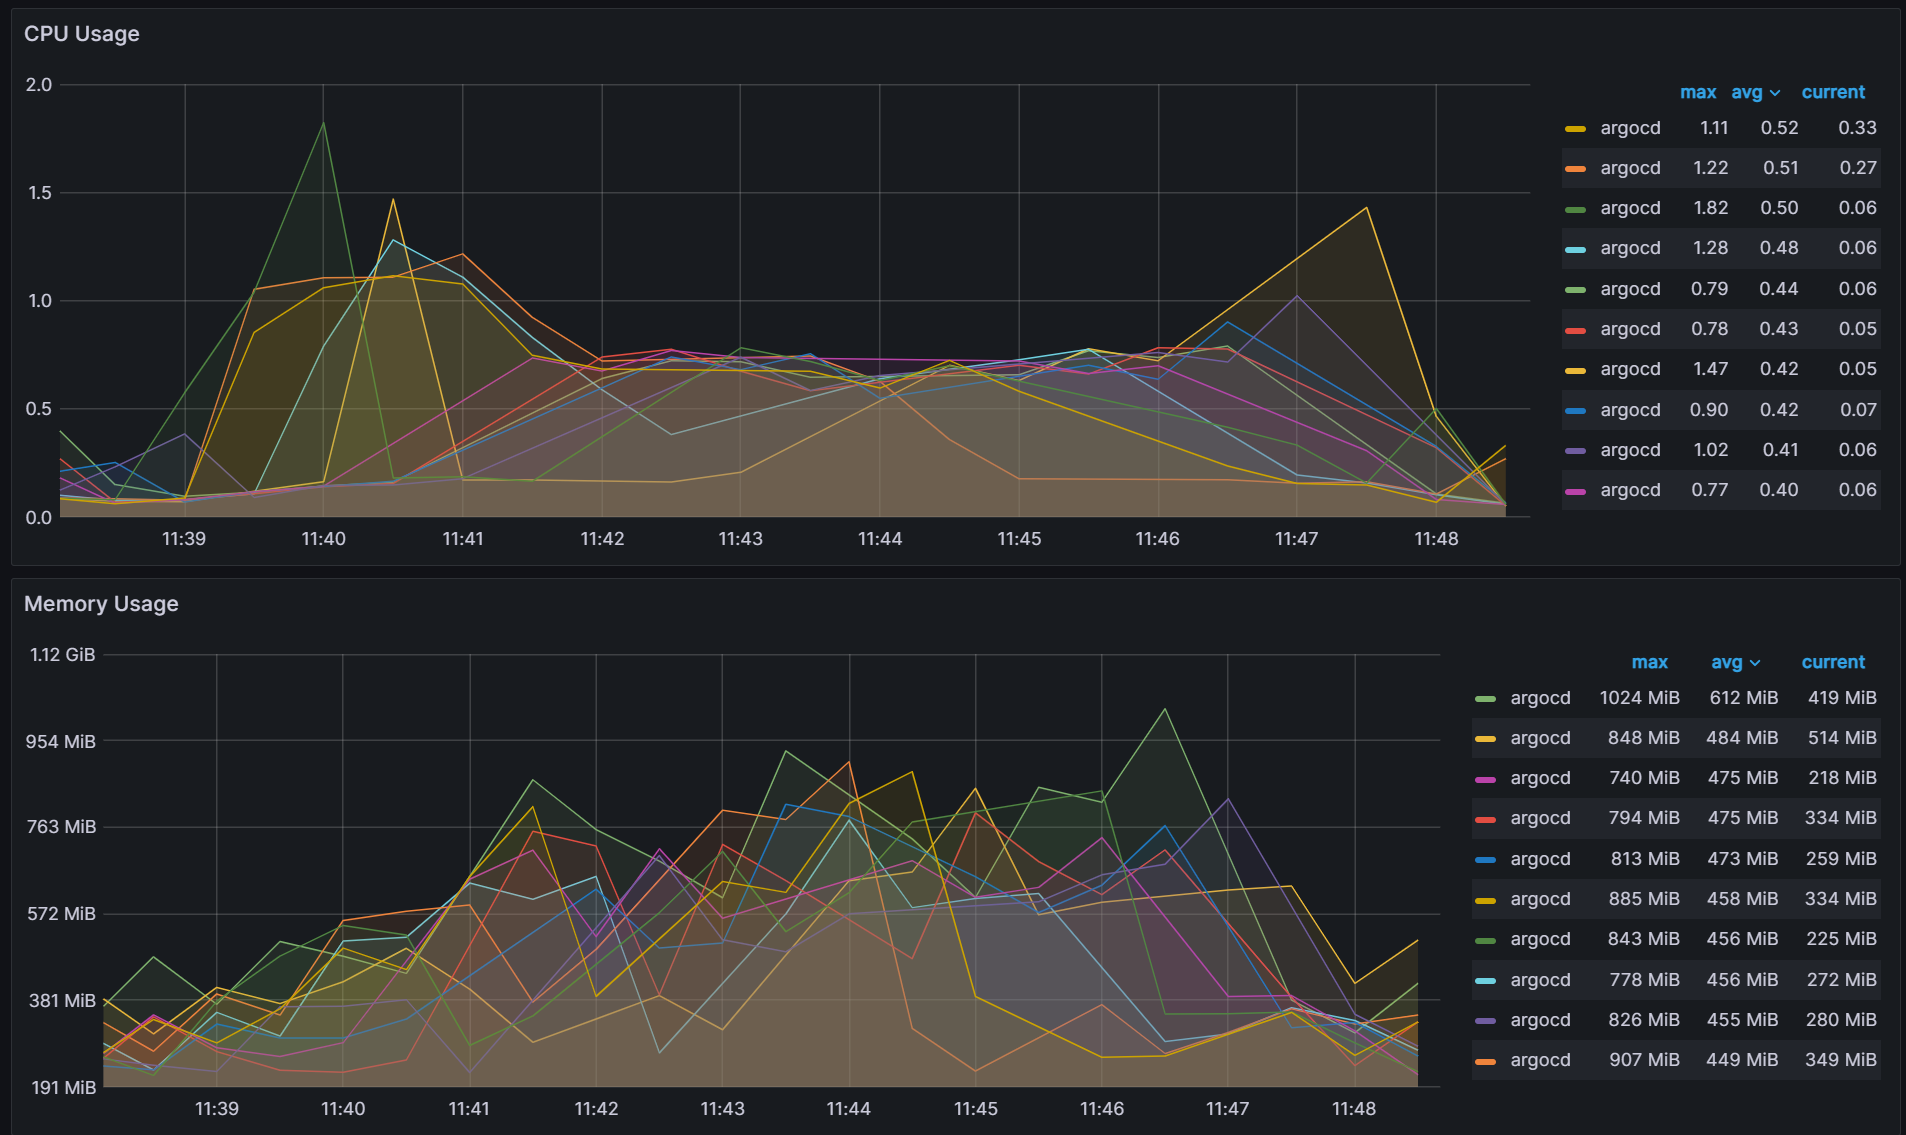
The same experiment with a random number of applications running on each cluster is run again with the results shown below. With the new algorithm, there is better balance across the shards.

Variability:
CPU:0.06
Memory:109 MiB

alt_text

While there is better balance when utilizing the greedy minimum algorithm, there is an issue when changing any aspect of the Argo CD sharding parameters. If you are adding shards, removing shards, adding clusters and/or removing clusters, the algorithm can trigger large scale changes in the shard assignments. Changes to the shard assignments cause shards to waste resources when switching to manage new clusters. This is especially true when utilizing ephemeral clusters in AI/ML training and big data operations where clusters come and go. Starting from the previous experiment from before, we changed the number of shards from 10 to 9 and observed over 75 cluster to shard assignment changes out of 100 clusters excluding the changes associated with the removed shard.

Weighted Ring Hash

In order to decrease the number of shard assignment changes, a well known method called consistent hashing is explored for our use case (Reference). Consistent hashing algorithms utilize a ring hash to determine distribution decisions. This method is already widely utilized by network load balancing applications to evenly distribute traffic in a distributed manner independent of the number of servers/nodes. By utilizing a ring hash algorithm to determine shard assignments, we were able to decrease the number of shard assignment changes when we changed the number of shards from 10 to 9. We observed 48 cluster to shard assignment changes, excluding the changes associated with the removed shard.
alt_text

To ensure balance, weighting is applied at each shard assignment to ensure the shard with the least number of apps is given the highest weight when choosing shards for assignment. The balancing is not perfect as you can see that CPU variability has increased from the greedy minimum algorithm of 0.06 to 0.12.

Variability:

CPU:0.12
Memory:163 MiB

Consistent Hash with Bounded Loads

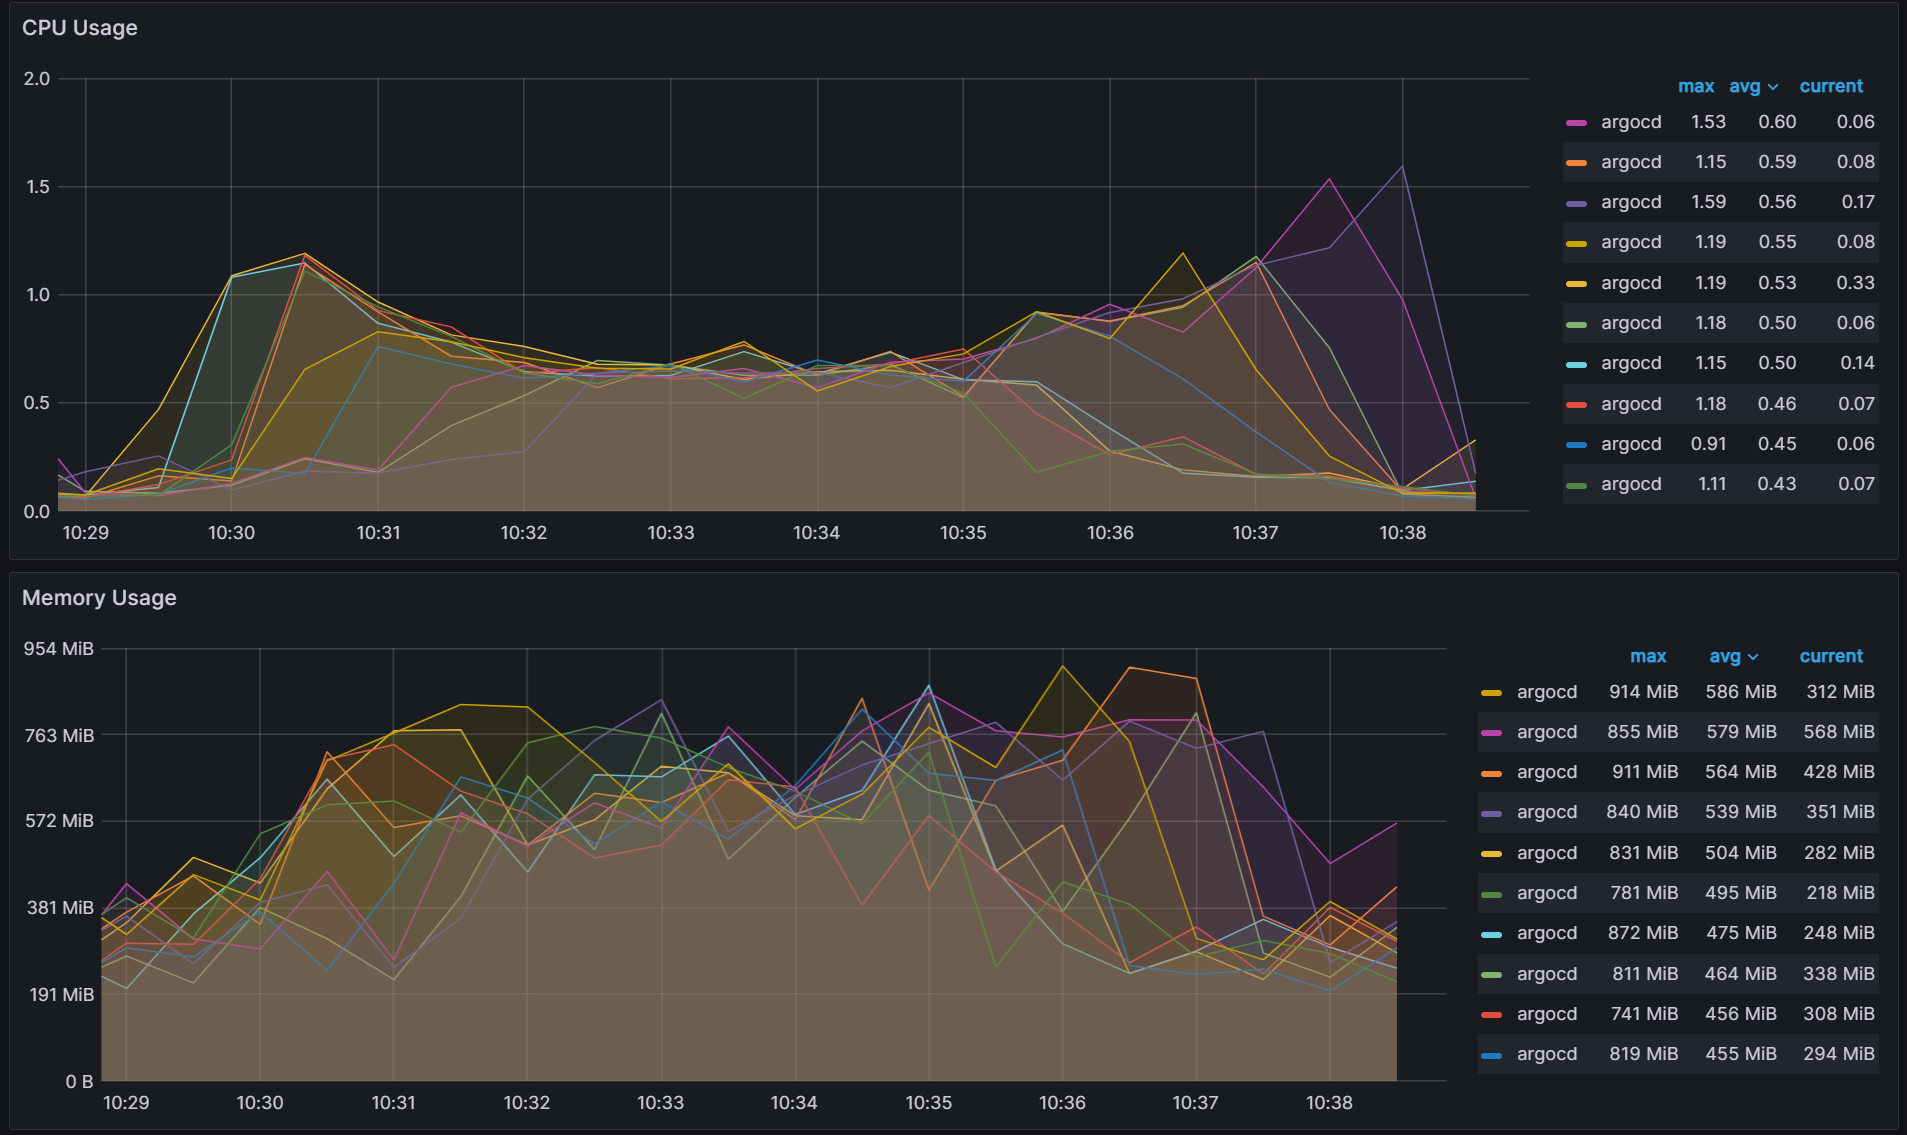
The ring hash algorithm was never designed to allow dynamically updating the weights based on load. While we were able to utilize it for this purpose, we looked at another algorithm called Consistent Hashing with Bounded Loads (Reference) which looks to solve the problem of consistent hashing and load uniformity. By utilizing this new algorithm, we were able to significantly decrease the redistribution of cluster to shard assignments. When we change the number of shards from 10 to 9, we only observed 15 cluster to shard assignment changes excluding the changes associated with the removed shard.
alt_text

The trade off is slightly worse cluster/app balancing than the weighted ring hash which increased CPU variability from 0.12 to 0.17.

Variability:

CPU:0.17
Memory:131 MiB

There are no direct recommendations about which algorithm you should utilize, as each of them have their pros and cons. You should evaluate each for your environment whether you are looking for strict balancing of clusters/apps across the shards or whether you want to minimize the impact of making frequent changes to your Argo CD environment.
Conclusion

In this blog post, we continued our scalability tests of the Argo CD app controller by answering some questions we had from our first scalability tests about the common scalability parameters. We showed how QPS/Burst QPS affects the k8s api server, determined why status/operation processors did not affect our previous scalability tests, and how those parameters are linked together. We then continued our scalability tests by pushing the Argo CD app controller to 500 clusters and 50,000 apps. We ended our tests by showing that a key component of scaling the Argo CD app controller is how it performs sharding. By doing a deep dive into how the app controller performs sharding we also determined some ways to improve sharding by adding in and evaluating new sharding algorithms. We are currently evaluating how to contribute these changes back to Argo CD. Stay tuned for those contributions and reach out on the CNCF #argo-sig-scalability or the #cnoe-interest Slack channel to get help optimizing for your use-cases and scenarios.